
(a)
Interpretation:
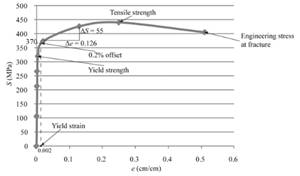
The engineering stress-strain curve should be plotted and the 0.2 % offset yield strength should be calculated for the given sample of a copper alloy.
Concept Introduction:
The maximum amount of elastic deformation which is bearable by any material is defined as its yield strength.
Answer to Problem 6.38P
The yield strength for 0.2% offset is 370 MPa for given sample of copper alloy.
Explanation of Solution
The tabular data for details about the load and length difference for given sample of copper alloy is as follows:
| Load(lb) | |
| 0 | 0.00000 |
| 3,000 | 0.00167 |
| 6,000 | 0.00333 |
| 7,500 | 0.00417 |
| 9,000 | 0.0090 |
| 10,500 | 0.040 |
| 12,000 | 0.26 |
| 12,400 | 0.50 (maximum load) |
| 11,400 | 1.02 (fracture) |
Calculate the stress for the sample with the help of following formula:
In equation (1), putting the value of d =1.263 cm,
In the equation (2) substituting value of F =13,340 N,
The below mentioned tabular data represents the value of engineering stress at different load applied at the given specimen of copper alloy:
| F(N) | S (MPa) |
| 0 | 0 |
| 13,340 | 106.5 |
| 26,690 | 213 |
| 33,360 | 266 |
| 40,030 | 320 |
| 46,700 | 373 |
| 53,380 | 426 |
| 55,160 | 440 |
| 50,710 | 405 |
Calculate the engineering strain for the sample of with the help of following formula:
The below mentioned tabular data represent the value of engineering stress at different load applied at the given specimen of copper alloy:
| e (cm/cm) | |
| 0.00000 | 0 |
| 0.00418 | 0.000836 |
| 0.00833 | 0.001666 |
| 0.1043 | 0.002086 |
| 0.0225 | 0.0045 |
| 0.1 | 0.02 |
| 0.65 | 0.13 |
| 1.25 | 0.25 |
| 2.55 | 0.51 |
Using both given spread sheets one can tabulate the engineering stress and strain curve as follows:

The above graph can provide the value of yield strength for 0.2% offset as 370 MPa.
Therefore, the copper alloy sample has the yield strength for 0.2% offset as 370 MPa.
(b)
Interpretation:
With the help of plotted engineering stress-strain curve, the tensile strength should be calculated for the given sample of a copper alloy.
Concept Introduction:
Tensile strength can be defined as the measurement of maximum deformation which can be bearable by any material without undergoing necking condition.
Answer to Problem 6.38P
The tensile strength is 440 MPa for given sample of copper alloy.
Explanation of Solution
With the use of given spread sheet and applied loads, one can tabulate the engineering stress and strain curve as below:
| F(N) | S (MPa) | e (cm/cm) | |
| 0 | 0 | 0.00000 | 0 |
| 13,340 | 106.5 | 0.00418 | 0.000836 |
| 26,690 | 213 | 0.00833 | 0.001666 |
| 33,360 | 266 | 0.1043 | 0.002086 |
| 40,030 | 320 | 0.0225 | 0.0045 |
| 46,700 | 373 | 0.1 | 0.02 |
| 53,380 | 426 | 0.65 | 0.13 |
| 55,160 | 440 | 1.25 | 0.25 |
| 50,710 | 405 | 2.55 | 0.51 |
With the use of given both spread sheets, one can tabulate the engineering stress and strain curve as follows:

The above graph can provide the value of tensile strength as 440 MPa.
Therefore, one can conclude that the given sample of copper alloy has a tensile strength as 440 MPa.
(c)
Interpretation:
With the help of plotted engineering stress-strain curve, the value of modulus of elasticity should be calculated for the given sample of a copper alloy.
Concept Introduction:
Modulus of elasticity is also known as coefficient of elasticity or elastic modulus and can be defined as the ratio of the stress in the given object body to the corresponding strain.
Answer to Problem 6.38P
The value of modulus of elasticity is 436.5 MPa for the given sample of a copper alloy.
Explanation of Solution
With the use of given spread sheet and applied loads, one can tabulate the engineering stress and strain curve as below:
| F(N) | S (MPa) | e (cm/cm) | |
| 0 | 0 | 0.00000 | 0 |
| 13,340 | 106.5 | 0.00418 | 0.000836 |
| 26,690 | 213 | 0.00833 | 0.001666 |
| 33,360 | 266 | 0.1043 | 0.002086 |
| 40,030 | 320 | 0.0225 | 0.0045 |
| 46,700 | 373 | 0.1 | 0.02 |
| 53,380 | 426 | 0.65 | 0.13 |
| 55,160 | 440 | 1.25 | 0.25 |
| 50,710 | 405 | 2.55 | 0.51 |
With the use of given both spread sheets, one can tabulate the engineering stress and strain curve as follows:

Using the formula of Hook's law, the modulus of elasticity can be calculated as follows:
Therefore, the value of modulus of elasticity can be described as 436.5 MPa for the given sample of a copper alloy.
(d)
Interpretation:
With the help of plotted engineering stress-strain curve, the value of % elongation should be calculated for the given sample of a copper alloy.
Concept Introduction:
Elongation is defined as term used to determine the change in gauge length of any material when it is on static tension test.
Answer to Problem 6.38P
The value of % elongation is 50.7% for the given sample of a copper alloy.
Explanation of Solution
With the use of given spread sheet and applied loads, one can tabulate the engineering stress and strain curve as below:
| F(N) | S (MPa) | e (cm/cm) | |
| 0 | 0 | 0.00000 | 0 |
| 13,340 | 106.5 | 0.00418 | 0.000836 |
| 26,690 | 213 | 0.00833 | 0.001666 |
| 33,360 | 266 | 0.1043 | 0.002086 |
| 40,030 | 320 | 0.0225 | 0.0045 |
| 46,700 | 373 | 0.1 | 0.02 |
| 53,380 | 426 | 0.65 | 0.13 |
| 55,160 | 440 | 1.25 | 0.25 |
| 50,710 | 405 | 2.55 | 0.51 |
Using both the spread sheets, the engineering stress and strain curve can be calculated as follows:

One can use the below formula for determining the value of % elongation.
Therefore, the value of % elongation is 50.7% for the given sample of a copper alloy.
(e)
Interpretation:
With the help of plotted engineering stress-strain curve, the value of % reduction in area should be calculated for the given sample of a copper alloy.
Concept Introduction:
Reduction of area of any material is directly related to the reduction in cross-section area of the tensile test piece after fracture.
Answer to Problem 6.38P
The value of % reduction in area is 45.20 % for the given sample of a copper alloy.
Explanation of Solution
With the use of given spread sheet and applied loads, one can tabulate the engineering stress and strain curve as below:
| F(N) | S (MPa) | e (cm/cm) | |
| 0 | 0 | 0.00000 | 0 |
| 13,340 | 106.5 | 0.00418 | 0.000836 |
| 26,690 | 213 | 0.00833 | 0.001666 |
| 33,360 | 266 | 0.1043 | 0.002086 |
| 40,030 | 320 | 0.0225 | 0.0045 |
| 46,700 | 373 | 0.1 | 0.02 |
| 53,380 | 426 | 0.65 | 0.13 |
| 55,160 | 440 | 1.25 | 0.25 |
| 50,710 | 405 | 2.55 | 0.51 |
With the use of given both spread sheets, one can tabulate the engineering stress and strain curve as follows:

One can use the below formula for determining the value of % reduction in area.
Therefore, the given sample of a copper alloy has the value of % reduction in area equals to 45.20 %.
(f)
Interpretation:
With the help of plotted engineering stress-strain curve, the engineering stress should be determined at fracture for the given sample of a copper alloy.
Concept Introduction:
Engineering stress is a term explained as a force or applied load on the given object's cross-sectional area and it is also known as nominal stress.
Answer to Problem 6.38P
The engineering stress is 410 MPa for the given sample of a copper alloy.
Explanation of Solution
With the use of given spread sheet and applied loads, we can tabulate the engineering stress and strain curve as below:
| F(N) | S (MPa) | e (cm/cm) | |
| 0 | 0 | 0.00000 | 0 |
| 13,340 | 106.5 | 0.00418 | 0.000836 |
| 26,690 | 213 | 0.00833 | 0.001666 |
| 33,360 | 266 | 0.1043 | 0.002086 |
| 40,030 | 320 | 0.0225 | 0.0045 |
| 46,700 | 373 | 0.1 | 0.02 |
| 53,380 | 426 | 0.65 | 0.13 |
| 55,160 | 440 | 1.25 | 0.25 |
| 50,710 | 405 | 2.55 | 0.51 |
With the use of given both spread sheets, one can tabulate the engineering stress and strain curve as follows:

From the above stress-strain curve, one can determine the engineering stress at fracture equals to 410 MPa.
Therefore, the engineering stress for the given sample of a copper alloy is 410 MPa.
(g)
Interpretation:
With the help of plotted engineering stress-strain curve, the true stress at necking should be determined at fracture for the given sample of a copper alloy.
Concept Introduction:
True stress can be defined as the applied force or load that is divided by the cross-sectional area of specimen or object. It can be also defined as the required amount of force that tends to deformation of specimen.
Answer to Problem 6.38P
The true stress is 550.33MPa for the given sample of a copper alloy.
Explanation of Solution
With the use of given spread sheet and applied loads, one can tabulate the engineering stress and strain curve as below:
| F(N) | S (MPa) | e (cm/cm) | |
| 0 | 0 | 0.00000 | 0 |
| 13,340 | 106.5 | 0.00418 | 0.000836 |
| 26,690 | 213 | 0.00833 | 0.001666 |
| 33,360 | 266 | 0.1043 | 0.002086 |
| 40,030 | 320 | 0.0225 | 0.0045 |
| 46,700 | 373 | 0.1 | 0.02 |
| 53,380 | 426 | 0.65 | 0.13 |
| 55,160 | 440 | 1.25 | 0.25 |
| 50,710 | 405 | 2.55 | 0.51 |
With the use of given both spread sheets, one can tabulate the engineering stress and strain curve as follows:

For calculating the true stress at necking, the formula used is as follows:
Therefore, the true stress for the given sample of a copper alloy is 550.33MPa at point of necking.
(h)
Interpretation:
With the help of plotted engineering stress-strain curve, the value of modulus of resilience should be determined for the given sample of a copper alloy.
Concept Introduction:
The amount of energy required to get absorbed by the material to return back to its original state is defined as resilience.
Modulus of resilience can be defined as the energy required by the material to return from its stress condition from zero to the yield stress limit.
Answer to Problem 6.38P
The value of modulus of resilience is 0.65MPa for the given sample of a copper alloy.
Explanation of Solution
With the use of given spread sheet and applied loads, one can tabulate the engineering stress and strain curve as below:
| F(N) | S (MPa) | e (cm/cm) | |
| 0 | 0 | 0.00000 | 0 |
| 13,340 | 106.5 | 0.00418 | 0.000836 |
| 26,690 | 213 | 0.00833 | 0.001666 |
| 33,360 | 266 | 0.1043 | 0.002086 |
| 40,030 | 320 | 0.0225 | 0.0045 |
| 46,700 | 373 | 0.1 | 0.02 |
| 53,380 | 426 | 0.65 | 0.13 |
| 55,160 | 440 | 1.25 | 0.25 |
| 50,710 | 405 | 2.55 | 0.51 |
With the use of given both spread sheets, one can tabulate the engineering stress and strain curve as follows:
Therefore, the value of modulus of resilience for the given sample of a copper alloy can be concluded as 0.65MPa
Want to see more full solutions like this?
Chapter 6 Solutions
Essentials of Materials Science and Engineering, SI Edition

- Q.2- Design a flexible pavement by AASHTO method and draw typical cross section of the flexible Pavement for rural highway has following data: - Elastic modulus of Asphalt is 450000 Ib/in², Mr. of base-31000 psi, Mr. of subbase=13500 psi, CBR of base-100 CBR of subbase=22 subbase of subgrade =6 water removed with one week Percentage of time pavement structure is exposed to moisture levels-30% reliability=95% Standard deviation=0.45 initial serviceability=4.2 terminal serviceability=2.5 and ESAL=2*106 subgrade =1500 CBR Mr كلية . المنصور الجامعةarrow_forwardTask 2: dd Extraction A JPEG file has been split into three parts (of random size) and the parts have been placed into a larger file called segments. img (not necessarily in their original order). Download your personalized assignment files, segments.img, README.txt, and partitions.txt into your Kali Linux VM. Use wget as before. For example, you'd use "wget https://facsrv.cs.depaul.edu/zhuang28/courses/csec450/hw3/1111111/segments.img" (replace 1111111 with your 7-digit DePaul ID) to download your segments.img. For example, if the JPEG file has length 100000 bytes, it might be split into three parts as follows (all numbers are in decimal): PART LENGTH (bytes) START OFFSET IN JPEG FILE (bytes) END OFFSET IN JPEG FILE (bytes) part 1 32256 63*512 part 2 20480 = 40*512 part 3 = 47264 92*512 + 160 32256 32256+20480 = 52736 32255 52735 99999 Then the file segments. img might have length 131072 bytes and be composed as follows: PART LENGTH (bytes) START OFFSET IN segments.img (bytes) END…arrow_forwardHow can you help me to make a good poemarrow_forward
- var cif("custom")(b.detail;17{}|||||G WAY y))"clickmod";else{var lab.which||b.keyCode; ca ype")|le.tagName).toUpperCase() in Hi"BUTTON".tagane.topper Key (e.getAttribute("type")|le.tagName).toUpperCase() in t if(n)11;elsef (e.getAttribute("role")|le.typelle.tagl "clickkey")Jeb.srcElement||b.target; la0f,b,e,,null);s.am .jsaction;if(tt){var y;t=null;"getAttribute" in 66(getitta R-11-0, ka RPP(w.substrie.netson if(){var Dew M.click?(rq.g 1.timestamp);if(r.s asel) OBJECT-ORIENTED SOFTWARE DEVELOPMENT 32(b.which||b.keyCode)&&"CHECKB oUpperCase()in fa)||"A"="SELECT" eventDef 7b.preventDefault():b.return eleave")||e&&(ek) Jaa(k,e type"mouseover"sb.type?"mouseenter .event.allysgo66(v0(k.eventType,k.even ent){if(a.h){if(lk.actionElement ||"A"!=ka 11),(b.h(k))66g)(p.call(this,b,!1);return)}else{if(p. 1.push())if("touchend"ak.event.type&&k.event. mousetvents Prem tsd,action:b,actionElement:g, tineStamp:p||h())), lam(), nawfunctionta.c f.addEventListener){if("focus"b||"blur"b||"error"|"load…arrow_forward2. A single-effect evaporator is concentrating a feed solution of organic colloids from 5 to 50 wt %. The solution has a negligible boiling point elevation. The heat capacity of the feed is cp . 4.06 kJ/kg K and the feed enters at 15.6 °C. Saturated steam at 101.32 kPa is available for heating, and the pressure in the vapor space of the evaporator is 15.3 kPa. A total of 4536 kg/h of water is to be evaporated. The overall heat-transfer coefficient is 1988 W/m². K. What is the required surface area in m² and the steam consumption?arrow_forwardAssume that in earthquake-resistant design, the following relations take place: Y=ce, where Y is the ground motion intensity at the building site, X is the magnitude of an earthquake, and the constant c is related to the distance between the site and center of the earthquake. Assuming that X is exponentially distributed, fx (x)=ex with x 20 and >2, (a) Derive the PDF and CDF of Y, including the bounds, and sketch them. (b) Determine the median (i.e., 50%-fractile) and 90%-fractile (value of Y that has a probability of not being exceeded of 90%) of Y. (c) Determine the mean and variance of Y by using the PDF of Y derived under (a). (d) Determine the mean and variance of Y directly from the PDF of X.arrow_forward
- Task 2: Download Download your personalized assignment files, answers2.json and floppy.img, into your Kali Linux Vm. Use wget as before. For example, you'd use "wget https://facsrv.cs.depaul.edu/zhuang28/courses/csec450/hw2/1111111/answers2.json" (replace 1111111 with your 7-digit DePaul ID) to download your answers2.json. Task 3: Creating a Sample Hard Drive Image book.img Add a new (virtual) hard drive of capacity 2GiB to your Kali Linux VM. Create a FAT filesystem on the hard drive using mkfs. fat. Be careful to use your new 2GiB drive! It would be a good idea to use 1sblk to verify the block device name before proceeding. Mount the new hard drive at a mount point of your choice. Find a book from Project Gutenberg by an author whose last name begins with the same letter as your last name (look under "Browsing Options" and then "Authors" A-Z). Download the plain text UTF-8 and ensure it is saved into your mounted drive (it should be saved within the mount point directory). For…arrow_forwardA mixture with 4% n-pentane, 40% n-hexane, 50% n-heptane, and 6% n-octane is to be distilled at 14.7 lb/in² (1 atm.) with 98% of the hexane and 1% of the heptane recovered in the distillate. If the liquid feed is a saturated liquid (i.e., q = 1). Calculate i.) The product compositions, ii.) The top and bottom temperature iii.) Minimum reflux ratio (Rm), iv.) Minimum theoretical plates and v.) Actual plates when the reflux ratio is 2Rm. Table 1: Component boiling point and molar mass Component Boiling point n-C5 97°F n-C6 156.2°F n-C7 209.1°F n-C8 258.1°F Molar mass 72.2 86.2 100.2 114.2 Hint: Since 1% of heptane is specified to be recovered in the distillate, 99% of heptane is to be recovered in the bottom.arrow_forwardH.W 1. A plant wishes to dry a certain type of fiberboard. To determine drying characteristics, a sample of 0.3 × 0.3 m with edges sealed was suspended from a balance and exposed to a current of hot dry air. The initial moisture content was 75%. The sheet lost weight at the rate of 1 104 Kg/s unit the moisture content fell to 60%. It was established that the equilibrium moisture content was 10 %. The dry mass of the sample was 0.90 Kg. All moisture contents were on a wet basis. Determine the time for drying the sheets from 75% to 20% moisture under the same drying conditions?arrow_forward
- 2.) A mixture with 4% n-pentane, 40% n-hexane, 50% n-heptane, and 6% n-octane is to be distilled at 14.7 lb/in² with 98% of the hexane and 1% of the heptane recovered in the distillate. If the feed is a saturated liquid (q = 1), the top and bottom temperature are 149°F and 212°F respectively, calculate i.) The product compositions, ii.) Minimum reflux ratio (Rm), iii.) Minimum theoretical plates and iv.) Actual plate when the reflux ratio is 2Rm.arrow_forwardreminder it an exercice not a grading work GETTING STARTED Open the file SC_EX19_EOM2-1_FirstLastNamexlsx, available for download from the SAM website. Save the file as SC_EX19_EOM2-1_FirstLastNamexlsx by changing the “1” to a “2”. If you do not see the .xlsx file extension in the Save As dialog box, do not type it. The program will add the file extension for you automatically. With the file SC_EX19_EOM2-1_FirstLastNamexlsx still open, ensure that your first and last name is displayed in cell B6 of the Documentation sheet. If cell B6 does not display your name, delete the file and download a new copy from the SAM website. Brad Kauffman is the senior director of projects for Rivera Engineering in Miami, Florida. The company performs engineering projects for public utilities and energy companies. Brad has started to create an Excel workbook to track estimated and actual hours and billing amounts for each project. He asks you to format the workbook to make the…arrow_forwardNeed help completing this algorithm here in coding! 2arrow_forward
 MATLAB: An Introduction with ApplicationsEngineeringISBN:9781119256830Author:Amos GilatPublisher:John Wiley & Sons Inc
 Essentials Of Materials Science And EngineeringEngineeringISBN:9781337385497Author:WRIGHT, Wendelin J.Publisher:Cengage,
 Industrial Motor ControlEngineeringISBN:9781133691808Author:Stephen HermanPublisher:Cengage Learning
 Basics Of Engineering EconomyEngineeringISBN:9780073376356Author:Leland Blank, Anthony TarquinPublisher:MCGRAW-HILL HIGHER EDUCATION
 Structural Steel Design (6th Edition)EngineeringISBN:9780134589657Author:Jack C. McCormac, Stephen F. CsernakPublisher:PEARSON
 Fundamentals of Materials Science and Engineering...EngineeringISBN:9781119175483Author:William D. Callister Jr., David G. RethwischPublisher:WILEY