
(a)
Interpretation:
The engineering stress-strain curve should be plotted and the 0.2 % offset yield strength should be calculated for the given data of a ductile cast iron.
Concept Introduction:
The maximum amount of elastic deformation which is bearable by any material is defined as yield strength.
Answer to Problem 6.41P
The yield strength for 0.2% offset is 274 MPa for given sample of a ductile cast iron.
Explanation of Solution
The tabular data providing details about the load and length difference for given sample is as follows:
| Load(lb) | |
| 0 | 0.00000 |
| 25,000 | 0.0185 |
| 50,000 | 0.0370 |
| 75,000 | 0.0555 |
| 90,000 | 0.20 |
| 105,000 | 0.60 |
| 120,000 | 1.56 |
| 131,000 | 4.00 (maximum load) |
| 125,000 | 7.52 (fracture) |
Now, let us first calculate area of a ductile iron sample by using the following formula:
In which
So, the area of the iron sample can be calculated as follows:
Now, determine the stress for the given specimen as follows:
For determining the strain of the given sample,
With the use of given spread sheet and applied loads, The tabulate form of the engineering stress and strain is as follows:
| Load (P)N | Area (A) | Stress ( | Change in length ( | Strain ( |
| 0 | 314.16 | 0 | 0 | 0 |
| 25,000 | 314.16 | 79.58 | 0.0185 | 0.000465 |
| 50,000 | 314.16 | 159.15 | 0.0370 | 0.000925 |
| 75,000 | 314.16 | 238.73 | 0.0555 | 0.0013875 |
| 90,000 | 314.16 | 286.48 | 0.20 | 0.005 |
| 105,000 | 314.16 | 334.22 | 0.60 | 0.015 |
| 120,000 | 314.16 | 381.97 | 1.56 | 0.039 |
| 131,000 (max. load) | 314.16 | 416.98 | 4.00 | 0.1 |
| 125,000 (fracture) | 314.16 | 397.87 | 7.52 | 0.188 |
Now, the plot of the stress-strain from the above tabular data is as follows:
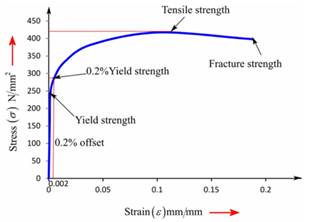
The above graph can provide the value of yield strength for 0.2% offset at around 274 MPa after drawing a parallel line to linear to stress-strain curve.
Therefore, the ductile cast iron contains the yield strength for 0.2% offset as 274 MPa.
(b)
Interpretation:
With the help of plotted engineering stress-strain curve, the tensile strength should be calculated for the given data of a ductile cast iron.
Concept Introduction:
Tensile strength can be defined as the measurement of maximum deformation which can be bearable by any material without undergoing necking condition.
Answer to Problem 6.41P
The tensile strength is 417 MPa for given sample of a ductile cast iron.
Explanation of Solution
With the use of given spread sheet and applied loads, engineering stress and strain can be tabulated as follows:
| Load (P)N | Area (A) | Stress ( | Change in length ( | Strain ( |
| 0 | 314.16 | 0 | 0 | 0 |
| 25,000 | 314.16 | 79.58 | 0.0185 | 0.000465 |
| 50,000 | 314.16 | 159.15 | 0.0370 | 0.000925 |
| 75,000 | 314.16 | 238.73 | 0.0555 | 0.0013875 |
| 90,000 | 314.16 | 286.48 | 0.20 | 0.005 |
| 105,000 | 314.16 | 334.22 | 0.60 | 0.015 |
| 120,000 | 314.16 | 381.97 | 1.56 | 0.039 |
| 131,000 (max. load) | 314.16 | 416.98 | 4.00 | 0.1 |
| 125,000 (fracture) | 314.16 | 397.87 | 7.52 | 0.188 |
Now, the stress-strain curve can be plotted from the above gathered tabular data as follows:
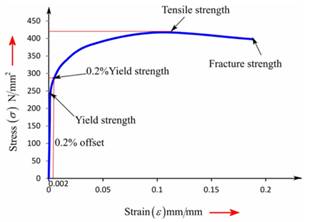
The above graph can provide the value of tensile strength as 417 MPa.
Therefore, the tensile strength for given sample of a ductile cast iron can be considered as417 MPa.
(c)
Interpretation:
With the help of plotted engineering stress-strain curve, the value of modulus of elasticity should be calculated for the given data of a ductile cast iron.
Concept Introduction:
Modulus of elasticity is also known as coefficient of elasticity or elastic modulus and can be defined as the ratio of the stress in the given object body to the corresponding strain.
Answer to Problem 6.41P
The value of modulus of elasticity is 172.057 GPa for a ductile cast iron..
Explanation of Solution
With the use of given spread sheet and applied loads, one can tabulate the engineering stress and strain as follows:
| Load (P)N | Area (A) | Stress ( | Change in length ( | Strain ( |
| 0 | 314.16 | 0 | 0 | 0 |
| 25,000 | 314.16 | 79.58 | 0.0185 | 0.000465 |
| 50,000 | 314.16 | 159.15 | 0.0370 | 0.000925 |
| 75,000 | 314.16 | 238.73 | 0.0555 | 0.0013875 |
| 90,000 | 314.16 | 286.48 | 0.20 | 0.005 |
| 105,000 | 314.16 | 334.22 | 0.60 | 0.015 |
| 120,000 | 314.16 | 381.97 | 1.56 | 0.039 |
| 131,000 (max. load) | 314.16 | 416.98 | 4.00 | 0.1 |
| 125,000 (fracture) | 314.16 | 397.87 | 7.52 | 0.188 |
Now, one can plot the stress-strain curve from the above gathered tabular data as follows:
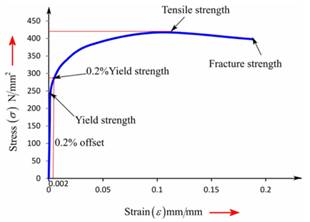
One can use the formula of Hook's law as below for calculating modulus of elasticity.
Therefore, the value of modulus of elasticity for a ductile cast iron can be described as 172.057GPa.
(d)
Interpretation:
With the help of plotted engineering stress-strain curve, the value of % elongation should be calculated for the given data of a ductile cast iron.
Concept Introduction:
Elongation is defined as term used to determine the change in gauge length of any material when it is on static tension test.
Answer to Problem 6.41P
The value of % elongation is 18.55% for a ductile cast iron.
Explanation of Solution
With the use of given spread sheet and applied loads, one can tabulate the engineering stress and strain as follows:
| Load (P)N | Area (A) | Stress ( | Change in length ( | Strain ( |
| 0 | 314.16 | 0 | 0 | 0 |
| 25,000 | 314.16 | 79.58 | 0.0185 | 0.000465 |
| 50,000 | 314.16 | 159.15 | 0.0370 | 0.000925 |
| 75,000 | 314.16 | 238.73 | 0.0555 | 0.0013875 |
| 90,000 | 314.16 | 286.48 | 0.20 | 0.005 |
| 105,000 | 314.16 | 334.22 | 0.60 | 0.015 |
| 120,000 | 314.16 | 381.97 | 1.56 | 0.039 |
| 131,000 (max. load) | 314.16 | 416.98 | 4.00 | 0.1 |
| 125,000 (fracture) | 314.16 | 397.87 | 7.52 | 0.188 |
Now, one can plot the stress-strain curve from the above gathered tabular data as follows:
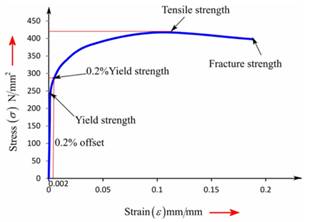
One can use the below formula for determining the value of % elongation.
Therefore, the ductile cast iron has 18.55% elongation value.
(e)
Interpretation:
With the help of plotted engineering stress-strain curve, the value of % reduction in area should be calculated for the given data of a ductile cast iron.
Concept Introduction:
Reduction of area of any material is directly related to the reduction in cross-section area of the tensile test piece after fracture.
Answer to Problem 6.41P
The value of % reduction in area is 15.82 % for given sample of a ductile cast iron.
Explanation of Solution
With the use of given spread sheet and applied loads, one can tabulate the engineering stress and strain as follows:
| Load (P)N | Area (A) | Stress ( | Change in length ( | Strain ( |
| 0 | 314.16 | 0 | 0 | 0 |
| 25,000 | 314.16 | 79.58 | 0.0185 | 0.000465 |
| 50,000 | 314.16 | 159.15 | 0.0370 | 0.000925 |
| 75,000 | 314.16 | 238.73 | 0.0555 | 0.0013875 |
| 90,000 | 314.16 | 286.48 | 0.20 | 0.005 |
| 105,000 | 314.16 | 334.22 | 0.60 | 0.015 |
| 120,000 | 314.16 | 381.97 | 1.56 | 0.039 |
| 131,000 (max. load) | 314.16 | 416.98 | 4.00 | 0.1 |
| 125,000 (fracture) | 314.16 | 397.87 | 7.52 | 0.188 |
Now, one can plot the stress-strain curve from the above gathered tabular data as follows:
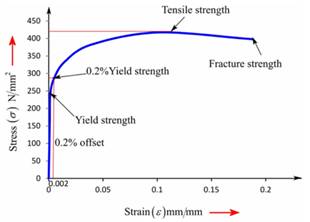
One can use the below formula for determining the value of % reduction in area.
Therefore, the ductile cast iron has 15.82% reduction in area.
(f)
Interpretation:
With the help of plotted engineering stress-strain curve, the engineering stress should be determined at fracture for the given data of a ductile cast iron.
Concept Introduction:
Engineering stress is a term explained as a force or applied load on the given object's cross-sectional area and it is also known as nominal stress.
Answer to Problem 6.41P
The engineering stress is 397.9 MPa for given sample of a ductile cast iron.
Explanation of Solution
With the use of given spread sheet and applied loads, one can tabulate the engineering stress and strain as follows:
| Load (P)N | Area (A) | Stress ( | Change in length ( | Strain ( |
| 0 | 314.16 | 0 | 0 | 0 |
| 25,000 | 314.16 | 79.58 | 0.0185 | 0.000465 |
| 50,000 | 314.16 | 159.15 | 0.0370 | 0.000925 |
| 75,000 | 314.16 | 238.73 | 0.0555 | 0.0013875 |
| 90,000 | 314.16 | 286.48 | 0.20 | 0.005 |
| 105,000 | 314.16 | 334.22 | 0.60 | 0.015 |
| 120,000 | 314.16 | 381.97 | 1.56 | 0.039 |
| 131,000 (max. load) | 314.16 | 416.98 | 4.00 | 0.1 |
| 125,000 (fracture) | 314.16 | 397.87 | 7.52 | 0.188 |
Now, one can plot the stress-strain curve from the above gathered tabular data as follows:
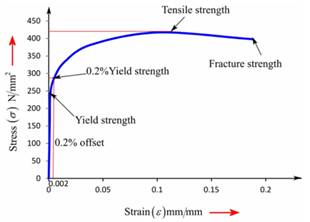
From the graph, one can determine the value of engineering stress at fracture as 397.9 MPa.
Therefore, the engineering stress can be considered as 397.9 MPa for given sample of a ductile cast iron.
(g)
Interpretation:
With the help of plotted engineering stress-strain curve, the true stress at necking should be determined at fracture for the given data of a ductile cast iron.
Concept Introduction:
True stress can be defined as the applied force or load that is divided by the cross-sectional area of specimen or object. It can be also defined as the required amount of force that tends to deformation of specimen.
Answer to Problem 6.41P
The true stress is 1472.69 MPa for given ductile cast iron at necking.
Explanation of Solution
With the use of given spread sheet and applied loads, one can tabulate the engineering stress and strain as follows:
| Load (P)N | Area (A) | Stress ( | Change in length ( | Strain ( |
| 0 | 314.16 | 0 | 0 | 0 |
| 25,000 | 314.16 | 79.58 | 0.0185 | 0.000465 |
| 50,000 | 314.16 | 159.15 | 0.0370 | 0.000925 |
| 75,000 | 314.16 | 238.73 | 0.0555 | 0.0013875 |
| 90,000 | 314.16 | 286.48 | 0.20 | 0.005 |
| 105,000 | 314.16 | 334.22 | 0.60 | 0.015 |
| 120,000 | 314.16 | 381.97 | 1.56 | 0.039 |
| 131,000 (max. load) | 314.16 | 416.98 | 4.00 | 0.1 |
| 125,000 (fracture) | 314.16 | 397.87 | 7.52 | 0.188 |
Now, one can plot the stress-strain curve from the above gathered tabular data as follows:
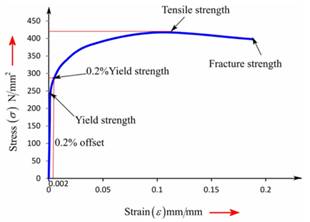
The formula for determining the strain of the given sample is as follows:
For calculating the true stress at necking, the formula used is as follows:
Therefore, the ductile cast iron has 1472.69 MP as a value of true stress at point of necking.
(h)
Interpretation:
With the help of plotted engineering stress-strain curve, the value of modulus of resilience should be determined for the given data of a ductile cast iron.
Concept Introduction:
The amount of energy required to get absorbed by the material to return back to its original state is defined as resilience.
Modulus of resilience can be defined as the energy required by the material to return from its stress condition from zero to the yield stress limit.
Answer to Problem 6.41P
The value of modulus of resilience is 0.17 MPa of given sample of ductile cast iron.
Explanation of Solution
With the use of given spread sheet and applied loads, one can tabulate the engineering stress and strain as below:
| Load (P)N | Area (A) | Stress ( | Change in length ( | Strain ( |
| 0 | 314.16 | 0 | 0 | 0 |
| 25,000 | 314.16 | 79.58 | 0.0185 | 0.000465 |
| 50,000 | 314.16 | 159.15 | 0.0370 | 0.000925 |
| 75,000 | 314.16 | 238.73 | 0.0555 | 0.0013875 |
| 90,000 | 314.16 | 286.48 | 0.20 | 0.005 |
| 105,000 | 314.16 | 334.22 | 0.60 | 0.015 |
| 120,000 | 314.16 | 381.97 | 1.56 | 0.039 |
| 131,000 (max. load) | 314.16 | 416.98 | 4.00 | 0.1 |
| 125,000 (fracture) | 314.16 | 397.87 | 7.52 | 0.188 |
Now, we can plot the stress-strain curve from the above gathered tabular data as below:
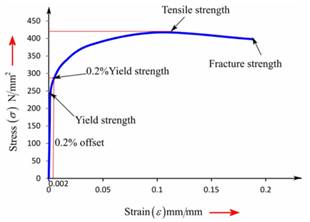
Therefore, the value of modulus of resilience can be considered as 0.17 MPa for the given sample of ductile cast iron.
Want to see more full solutions like this?
Chapter 6 Solutions
Essentials of Materials Science and Engineering, SI Edition
- 1) (2pts) If you know you have a bad clock (lots of jitter) and you are not bandwidth constrained, you should: (Circle the correct answer) a) Set the roll off factor to zero b) Set the roll off factor to ½ c) Set the roll off factor to one 2) (2pts) Short answer: Why do we use M-ary modulation? 3) (4 pts) Short answer: The application engineer comes to your desk and says that the error rate is too high and must be reduced for the application to function correctly. The system is battery operated. What do you tell them is the trade- off?arrow_forwardCalculate the BMs (bending moments) at all the joints of the beam shown in Fig.1 using the Slope Deflection method. The beam is subjected to an UDL of w=65m. L=4.5m L1= 1.8m. Assume the support at C is pinned, and A and B are roller supports. E = 200GPa, I = 250x106 mm4.arrow_forwardi need helppp pleasearrow_forward
- 5) (20 pts) You are testing a system that has pulse shape shown below for Logic 1 and Logic 0. You are connecting the transmitter to an oscilloscope which is set up to display the resulting eye-diagram of the system. Sketch what you would expect to see on the oscilloscope for an ideal system (an ideal system is noiseless and jitter free) Logic 1 3 volts Time 0 Ть Logic 0 0 Ть Time -2 voltsarrow_forward4. (20 pts) You are given a channel with the following impulse response. Determine the set of equations that will be used to determine the coefficients of a Zero-Forcing Linear Equalizer. DO NOT SOLVE FOR THE COEFFICIENTS. Just show the set of equation that would be used to solved the coefficients. 0 m≤-31 -0.33 m = -2 .25 m = -1 h(mb) = 1 m = 0 -0.45 m = 1 0.5 m = 2 0 m≥3arrow_forwardI need help understanding part B. See attached photo.arrow_forward
- i need helppp pleasearrow_forward3) (30pts) An application requires a bit rate of 18.2 Kbps and an error rate of less than 104. The channel has a noise power spectral density of 10-8 W/Hz. The channel attenuates the power in the signal by 5 dB. The system uses binary PAM baseband digital communication system with the minimum required bandwidth and a roll-off factor of 0.319. a) (10 pts) What is the estimated minimum required signal power (Pt) at the transmitter?arrow_forwardA common measure of transmission for digital data is the baud rate, defined as the number of bits transmitted per second. Generally, transmission is accomplished in packets consisting of starting bit, a byte of information, and a stop bit. Using this approach, answer the following. a) How many minutes would it take to transmit a 512×512 image with 128 grey Levels at 300 baud? b) What would the time be at 9600 baud? c) Repeat (a) and (b) for a 1024×1024 image 128 grey levelsarrow_forward
 MATLAB: An Introduction with ApplicationsEngineeringISBN:9781119256830Author:Amos GilatPublisher:John Wiley & Sons Inc
 Essentials Of Materials Science And EngineeringEngineeringISBN:9781337385497Author:WRIGHT, Wendelin J.Publisher:Cengage,
 Industrial Motor ControlEngineeringISBN:9781133691808Author:Stephen HermanPublisher:Cengage Learning
 Basics Of Engineering EconomyEngineeringISBN:9780073376356Author:Leland Blank, Anthony TarquinPublisher:MCGRAW-HILL HIGHER EDUCATION
 Structural Steel Design (6th Edition)EngineeringISBN:9780134589657Author:Jack C. McCormac, Stephen F. CsernakPublisher:PEARSON
 Fundamentals of Materials Science and Engineering...EngineeringISBN:9781119175483Author:William D. Callister Jr., David G. RethwischPublisher:WILEY


