
Concept explainers
Videos
To analyze: The polynomial function.
Answer to Problem 96AYU
.
Explanation of Solution
Given:
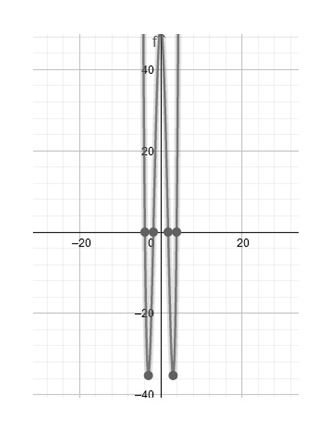
Step 1: Determine the end behavior of the graph of the function.
Analyze the graph of the polynomial function.
The polynomial function is of degree 4. The graph of behaves like for large values of .
Step 2: Graph the function using a graphing utility.
Step 3: Use a graphic utility to approximate the and of the graph.
The .
Using graphic utility find the lone .
Step 4: Using the graphic utility to find the points on the graph around each .
The points are on the graph.
Step 5: Approximate the turning point of the graph.
From the graph of , we see has 3 turning points.
Using the graph maximum turning point rounded to two decimal places.
Using the graph minimum turning point and rounded to two decimal places.
Step 6: Redraw the graph.
The graph passes through .
The end behavior of the graph .
Step 7: Find the domain and range of the function.
The domain and range is the set of all real numbers.
Step 8: Use the graph to determine where the function is increasing or where it is decreasing.
Based on the graph, is increasing on the intervals and .
Based on the graph, is decreasing and .
Chapter 4 Solutions
Precalculus Enhanced with Graphing Utilities
Additional Math Textbook Solutions
A Problem Solving Approach To Mathematics For Elementary School Teachers (13th Edition)
Algebra and Trigonometry (6th Edition)
Introductory Statistics
Elementary Statistics
Basic Business Statistics, Student Value Edition
Elementary Statistics (13th Edition)


- The Cartesian coordinates of a point are given. (a) (-8, 8) (i) Find polar coordinates (r, 0) of the point, where r > 0 and 0 ≤ 0 0 and 0 ≤ 0 < 2π. (1, 0) = (r. = ([ (ii) Find polar coordinates (r, 8) of the point, where r < 0 and 0 ≤ 0 < 2π. (5, 6) = =([arrow_forwardThe Cartesian coordinates of a point are given. (a) (4,-4) (i) Find polar coordinates (r, e) of the point, where r > 0 and 0 0 and 0 < 0 < 2π. (r, 6) = X 7 (ii) Find polar coordinates (r, 8) of the point, where r < 0 and 0 0 < 2π. (r, 0) = Xarrow_forwardr>0 (r, 0) = T 0 and one with r 0 2 (c) (9,-17) 3 (r, 8) (r, 8) r> 0 r<0 (r, 0) = (r, 8) = X X X x x Warrow_forward
- 74. Geometry of implicit differentiation Suppose x and y are related 0. Interpret the solution of this equa- by the equation F(x, y) = tion as the set of points (x, y) that lie on the intersection of the F(x, y) with the xy-plane (z = 0). surface Z = a. Make a sketch of a surface and its intersection with the xy-plane. Give a geometric interpretation of the result that dy dx = Fx F χ y b. Explain geometrically what happens at points where F = 0. yarrow_forwardExample 3.2. Solve the following boundary value problem by ADM (Adomian decomposition) method with the boundary conditions მი მი z- = 2x²+3 дг Əz w(x, 0) = x² - 3x, θω (x, 0) = i(2x+3). ayarrow_forward6. A particle moves according to a law of motion s(t) = t3-12t2 + 36t, where t is measured in seconds and s is in feet. (a) What is the velocity at time t? (b) What is the velocity after 3 s? (c) When is the particle at rest? (d) When is the particle moving in the positive direction? (e) What is the acceleration at time t? (f) What is the acceleration after 3 s?arrow_forward
 Calculus: Early TranscendentalsCalculusISBN:9781285741550Author:James StewartPublisher:Cengage Learning
 Thomas' Calculus (14th Edition)CalculusISBN:9780134438986Author:Joel R. Hass, Christopher E. Heil, Maurice D. WeirPublisher:PEARSON
 Calculus: Early Transcendentals (3rd Edition)CalculusISBN:9780134763644Author:William L. Briggs, Lyle Cochran, Bernard Gillett, Eric SchulzPublisher:PEARSON
 Calculus: Early TranscendentalsCalculusISBN:9781319050740Author:Jon Rogawski, Colin Adams, Robert FranzosaPublisher:W. H. Freeman
 Calculus: Early Transcendental FunctionsCalculusISBN:9781337552516Author:Ron Larson, Bruce H. EdwardsPublisher:Cengage Learning