
Videos
To analyze: The graph of Rational function
Answer to Problem 38RE
The domain is
The vertical asymptote is
The horizontal asymptote is
Explanation of Solution
Given information:
The rational function
Formula used:
Vertical Asymptote: A rational function
asymptote
Horizontal Asymptote: If a rational function is proper , the line
Oblique Asymptote : it occur when the degree of the denominator of a rational
function is one less than the degree of the numerator. The asymptote will be along line
Calculation:
Consider ,
Numerator:-
Denominator:-
Therefore,
Step 1.
The domain of G is the set of all real numbers except
Step 2.
Now, G is in the lowest terms.
Step 3.
Now, the intercepts of the graph G are as follows:
x -intercept of the graph G
The x -intercept is
y -intercept:- Since 0 is included in domain.
Thus, y -intercept is
Step 4.
Denominator:-
The real zeros of the denominator G is
Step 5.
Since the degree of the numerator ,2,is equal to the degree of denominator 2.
The quotient of G is the leading coefficient of the numerator,1, and the leading coefficient of the denominator ,1.
The horizontal asymptote of the graph G is
Now, solving the equation we get,
.
This implies the graph intersect the line
Hence,
Step 6.
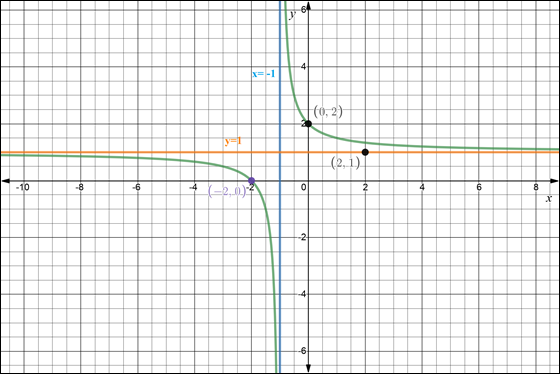
Figure 1.
Step 7.
Using the information gathered from Step 1 − Step 5 the graph of G has been drawn. The green color shows the graph G(x). The graph has the vertical asymptote at
Chapter 4 Solutions
Precalculus Enhanced with Graphing Utilities
Additional Math Textbook Solutions
A Problem Solving Approach To Mathematics For Elementary School Teachers (13th Edition)
Thinking Mathematically (6th Edition)
College Algebra with Modeling & Visualization (5th Edition)
Introductory Statistics
University Calculus: Early Transcendentals (4th Edition)
Elementary Statistics (13th Edition)


- Find a plane containing the point (3, -3, 1) and the line of intersection of the planes 2x + 3y - 3z = 14 and -3x - y + z = −21. The equation of the plane is:arrow_forwardDetermine whether the lines L₁ : F(t) = (−2, 3, −1)t + (0,2,-3) and L2 : ƒ(s) = (2, −3, 1)s + (−10, 17, -8) intersect. If they do, find the point of intersection. ● They intersect at the point They are skew lines They are parallel or equalarrow_forwardAnswer questions 2arrow_forward
- How does a fourier transform works?arrow_forwardDetermine the radius of convergence of a power series:12.6.5, 12.6.6, 12.6.7, 12.6.8Hint: Use Theorem12.5.1 and root test, ratio test, integral testarrow_forwardCan you answer this question and give step by step and why and how to get it. Can you write it (numerical method)arrow_forward
- Can you answer this question and give step by step and why and how to get it. Can you write it (numerical method)arrow_forwardThere are three options for investing $1150. The first earns 10% compounded annually, the second earns 10% compounded quarterly, and the third earns 10% compounded continuously. Find equations that model each investment growth and use a graphing utility to graph each model in the same viewing window over a 20-year period. Use the graph to determine which investment yields the highest return after 20 years. What are the differences in earnings among the three investment? STEP 1: The formula for compound interest is A = nt = P(1 + − − ) n², where n is the number of compoundings per year, t is the number of years, r is the interest rate, P is the principal, and A is the amount (balance) after t years. For continuous compounding, the formula reduces to A = Pert Find r and n for each model, and use these values to write A in terms of t for each case. Annual Model r=0.10 A = Y(t) = 1150 (1.10)* n = 1 Quarterly Model r = 0.10 n = 4 A = Q(t) = 1150(1.025) 4t Continuous Model r=0.10 A = C(t) =…arrow_forwardUse a graphing utility to find the point of intersection, if any, of the graphs of the functions. Round your result to three decimal places. (Enter NONE in any unused answer blanks.) y = 100e0.01x (x, y) = y = 11,250 ×arrow_forward
- 5. For the function y-x³-3x²-1, use derivatives to: (a) determine the intervals of increase and decrease. (b) determine the local (relative) maxima and minima. (e) determine the intervals of concavity. (d) determine the points of inflection. (e) sketch the graph with the above information indicated on the graph.arrow_forwardCan you solve this 2 question numerical methodarrow_forward1. Estimate the area under the graph of f(x)-25-x from x=0 to x=5 using 5 approximating rectangles Using: (A) right endpoints. (B) left endpoints.arrow_forward
 Calculus: Early TranscendentalsCalculusISBN:9781285741550Author:James StewartPublisher:Cengage Learning
 Thomas' Calculus (14th Edition)CalculusISBN:9780134438986Author:Joel R. Hass, Christopher E. Heil, Maurice D. WeirPublisher:PEARSON
 Calculus: Early Transcendentals (3rd Edition)CalculusISBN:9780134763644Author:William L. Briggs, Lyle Cochran, Bernard Gillett, Eric SchulzPublisher:PEARSON
 Calculus: Early TranscendentalsCalculusISBN:9781319050740Author:Jon Rogawski, Colin Adams, Robert FranzosaPublisher:W. H. Freeman
 Calculus: Early Transcendental FunctionsCalculusISBN:9781337552516Author:Ron Larson, Bruce H. EdwardsPublisher:Cengage Learning