
Concept explainers
Videos
(a)
To graph: The
(a)
Explanation of Solution
Given information:
The data is given percentage of persons in the United States whose income is below the poverty line..
Graph:
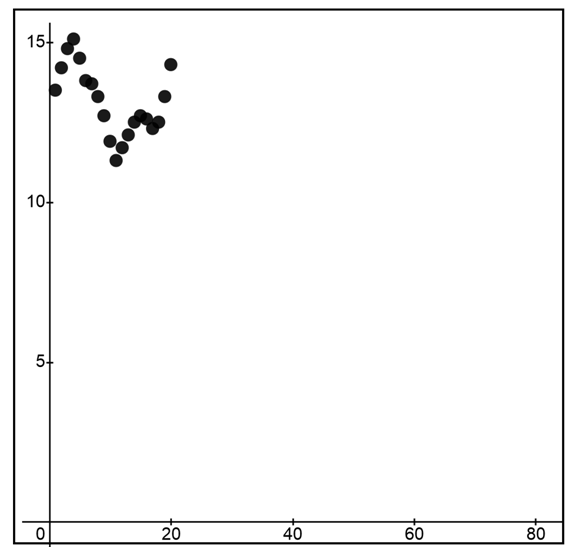
Figure 1.
Interpretation:
The graph represents the percentage of persons in the United States whose income is below the poverty line. The graph is drawn using graphing utility. The x -axis represents the percent below poverty level say p whereas y -axis is the time say t .
The scatter represent the cubic relation that appears to exist between the two variables.
(b)
The function of bets fit to the data. Also, predict the percentage of persons that were below the poverty level in 2010 with time 21.
(b)
Answer to Problem 47RE
The function is
At time 21 the percentage of poverty level is
Explanation of Solution
Given:
The given data.
Concept Used:
Use of Maple software.
Calculation:
The function of best fit to these data is cubic.
Now,
Conclusion:
The function is
At time 21 the percentage of poverty level is
(c)
To graph: The scatter diagram with the function of the given data.
(c)
Explanation of Solution
Given information:
The data is given percentage of persons in the United States whose income is below the poverty line.
Graph:
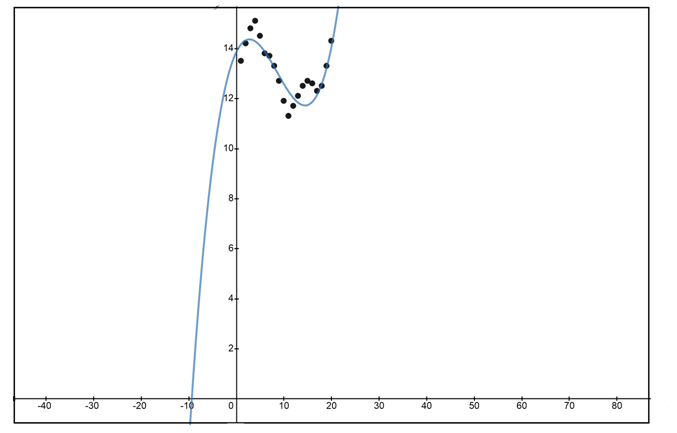
Figure 2.
Interpretation:
The graph represents the percentage of persons in the United States whose income is below the poverty line. The relation between the scatters are cubic. Hence, the curve is the function that fits the data . The graph is drawn using graphing utility. The x -axis represents the percent below poverty level say p whereas y -axis is the time say t .
Chapter 4 Solutions
Precalculus Enhanced with Graphing Utilities
Additional Math Textbook Solutions
A First Course in Probability (10th Edition)
A Problem Solving Approach To Mathematics For Elementary School Teachers (13th Edition)
Introductory Statistics
Basic Business Statistics, Student Value Edition
Elementary Statistics (13th Edition)


- 6. Solve the system of differential equations using Laplace Transforms: x(t) = 3x₁ (t) + 4x2(t) x(t) = -4x₁(t) + 3x2(t) x₁(0) = 1,x2(0) = 0arrow_forward3. Determine the Laplace Transform for the following functions. Show all of your work: 1-t, 0 ≤t<3 a. e(t) = t2, 3≤t<5 4, t≥ 5 b. f(t) = f(tt)e-3(-) cos 4τ drarrow_forward4. Find the inverse Laplace Transform Show all of your work: a. F(s) = = 2s-3 (s²-10s+61)(5-3) se-2s b. G(s) = (s+2)²arrow_forward
- 1. Consider the differential equation, show all of your work: dy =(y2)(y+1) dx a. Determine the equilibrium solutions for the differential equation. b. Where is the differential equation increasing or decreasing? c. Where are the changes in concavity? d. Suppose that y(0)=0, what is the value of y as t goes to infinity?arrow_forward2. Suppose a LC circuit has the following differential equation: q'+4q=6etcos 4t, q(0) = 1 a. Find the function for q(t), use any method that we have studied in the course. b. What is the transient and the steady-state of the circuit?arrow_forward5. Use variation of parameters to find the general solution to the differential equation: y" - 6y' + 9y=e3x Inxarrow_forward
- Let the region R be the area enclosed by the function f(x) = ln (x) + 2 and g(x) = x. Write an integral in terms of x and also an integral in terms of y that would represent the area of the region R. If necessary, round limit values to the nearest thousandth. 5 4 3 2 1 y x 1 2 3 4arrow_forward(28 points) Define T: [0,1] × [−,0] → R3 by T(y, 0) = (cos 0, y, sin 0). Let S be the half-cylinder surface traced out by T. (a) (4 points) Calculate the normal field for S determined by T.arrow_forward(14 points) Let S = {(x, y, z) | z = e−(x²+y²), x² + y² ≤ 1}. The surface is the graph of ze(+2) sitting over the unit disk. = (a) (4 points) What is the boundary OS? Explain briefly. (b) (4 points) Let F(x, y, z) = (e³+2 - 2y, xe³±² + y, e²+y). Calculate the curl V × F.arrow_forward
- (6 points) Let S be the surface z = 1 − x² - y², x² + y² ≤1. The boundary OS of S is the unit circle x² + y² = 1. Let F(x, y, z) = (x², y², z²). Use the Stokes' Theorem to calculate the line integral Hint: First calculate V x F. Jos F F.ds.arrow_forward(28 points) Define T: [0,1] × [−,0] → R3 by T(y, 0) = (cos 0, y, sin 0). Let S be the half-cylinder surface traced out by T. (a) (4 points) Calculate the normal field for S determined by T.arrow_forwardI need the last answer t=? I did got the answer for the first two this is just homework.arrow_forward
 Calculus: Early TranscendentalsCalculusISBN:9781285741550Author:James StewartPublisher:Cengage Learning
 Thomas' Calculus (14th Edition)CalculusISBN:9780134438986Author:Joel R. Hass, Christopher E. Heil, Maurice D. WeirPublisher:PEARSON
 Calculus: Early Transcendentals (3rd Edition)CalculusISBN:9780134763644Author:William L. Briggs, Lyle Cochran, Bernard Gillett, Eric SchulzPublisher:PEARSON
 Calculus: Early TranscendentalsCalculusISBN:9781319050740Author:Jon Rogawski, Colin Adams, Robert FranzosaPublisher:W. H. Freeman
 Calculus: Early Transcendental FunctionsCalculusISBN:9781337552516Author:Ron Larson, Bruce H. EdwardsPublisher:Cengage Learning