
Concept explainers
Videos
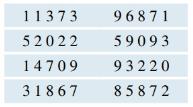
Simulating Guessing on a Multiple-Choice Test Suppose a student takes a 10-question multiple-choice quiz, and for each question on the quiz there are five possible options. Only one option is correct. Now suppose the student, who did not study, guesses at random for each question. A passing grade is 3 (or more) correct. We wish to design a simulation to find the
a. In this simulation, the random action consists of a student guessing on a question that has five
possible answers. We will simulate this by selecting a single digit from the random number
table given in this exercise.
In this table, we will let 0 and 1 represent correct answers, and 2 through 9 will represent
incorrect answers. Explain why this is a correct approach for the exam questions with five
possible answers.
(This completes the first two steps of the simulation summary given in Section 5.4.)
b. A trial, in this simulation, consists of picking 10 digits in a row. Each digit represents one guess on a question on the exam. Write the sequence of numbers from the first trial. Also translate this to correct and incorrect answers by writing R for right and W for wrong. (This completes step 4.)
c. We are interested in knowing whether there were 3 or more correct answers chosen. Did this occur in the first trial? (This completes step 5.)
d. Perform a second simulation of the student taking this 10-question quiz by guessing randomly. Use the second line of the table given. What score did your student get? Did the
e. Repeat the trial twice more, using lines 3 and 4 of the table. For each trial, write the score and whether or not the event occurred.
f. On the basis of these four trials, what is the empirical probability of passing the exam by guessing?
Want to see the full answer?
Check out a sample textbook solution
Chapter 5 Solutions
Introductory Statistics
Additional Math Textbook Solutions
A First Course in Probability (10th Edition)
Basic Business Statistics, Student Value Edition
Elementary Statistics
Pre-Algebra Student Edition
University Calculus: Early Transcendentals (4th Edition)
A Problem Solving Approach To Mathematics For Elementary School Teachers (13th Edition)


- A marketing agency wants to determine whether different advertising platforms generate significantly different levels of customer engagement. The agency measures the average number of daily clicks on ads for three platforms: Social Media, Search Engines, and Email Campaigns. The agency collects data on daily clicks for each platform over a 10-day period and wants to test whether there is a statistically significant difference in the mean number of daily clicks among these platforms. Conduct ANOVA test. You can provide your answer by inserting a text box and the answer must include: also please provide a step by on getting the answers in excel Null hypothesis, Alternative hypothesis, Show answer (output table/summary table), and Conclusion based on the P value.arrow_forwardA company found that the daily sales revenue of its flagship product follows a normal distribution with a mean of $4500 and a standard deviation of $450. The company defines a "high-sales day" that is, any day with sales exceeding $4800. please provide a step by step on how to get the answers Q: What percentage of days can the company expect to have "high-sales days" or sales greater than $4800? Q: What is the sales revenue threshold for the bottom 10% of days? (please note that 10% refers to the probability/area under bell curve towards the lower tail of bell curve) Provide answers in the yellow cellsarrow_forwardBusiness Discussarrow_forward
- The following data represent total ventilation measured in liters of air per minute per square meter of body area for two independent (and randomly chosen) samples. Analyze these data using the appropriate non-parametric hypothesis testarrow_forwardeach column represents before & after measurements on the same individual. Analyze with the appropriate non-parametric hypothesis test for a paired design.arrow_forwardShould you be confident in applying your regression equation to estimate the heart rate of a python at 35°C? Why or why not?arrow_forward
 College Algebra (MindTap Course List)AlgebraISBN:9781305652231Author:R. David Gustafson, Jeff HughesPublisher:Cengage Learning
 Algebra & Trigonometry with Analytic GeometryAlgebraISBN:9781133382119Author:SwokowskiPublisher:Cengage
 Holt Mcdougal Larson Pre-algebra: Student Edition...AlgebraISBN:9780547587776Author:HOLT MCDOUGALPublisher:HOLT MCDOUGAL
 Glencoe Algebra 1, Student Edition, 9780079039897...AlgebraISBN:9780079039897Author:CarterPublisher:McGraw Hill
 Algebra and Trigonometry (MindTap Course List)AlgebraISBN:9781305071742Author:James Stewart, Lothar Redlin, Saleem WatsonPublisher:Cengage Learning