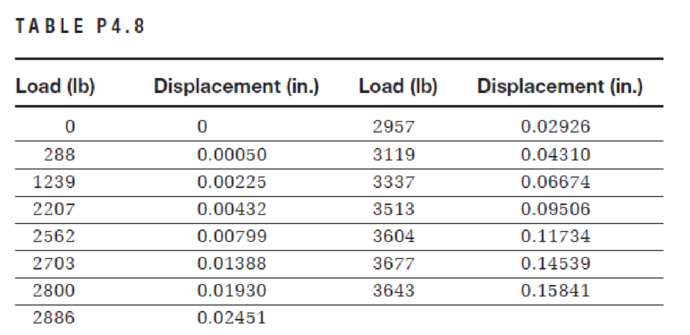
A round aluminum alloy bar with a 0.25-in. diameter and a 1-in. gauge length was tested in tension to fracture according to ASTM E-8 method. The load and deformation data were as shown in Table P4.8.

Using a spreadsheet program, obtain the following:
a. A plot of the stress–strain relationship. Label the axes and show units.
b. A plot of the linear portion of the stress–strain relationship. Determine modulus of elasticity using the best fit approach.
c. Proportional limit.
d. Yield stress at an offset strain of 0.002 in/in.
e. Initial tangent modulus.
f. If the specimen is loaded to 3200 lb only and then unloaded, what is the permanent change in gauge length?
g. When the applied load was 1239 lb, the diameter was measured as 0.249814 in. Determine Poisson’s ratio.
Want to see the full answer?
Check out a sample textbook solution
Chapter 4 Solutions
Materials for Civil and Construction Engineers (4th Edition)
- Q.2 The girder AB as shown in Fig. 2 has a span of 18m and supports concentrated loads located as shown. Determine the plastic moment capacity MP and the plastic collapse load Pc for the given load conditions. Use either Equilibrium drVirtual Work method in your solution. [30 marks] 5P 5P C d B 6 m 6 m 6 m 18 m Fig. 2 - Prismatic Continuousarrow_forward337 kN -Weld -25° 6 mm PROBLEM 1.33 A steel pipe of 300 mm outer diameter is fabricated from 6 mm thick plate by welding along a helix which forms an angle of 25° with a plane perpendicular to the axis of the pipe. Knowing that the maximum allowable normal and shearing stresses in directions respectively normal and tangential to the weld are σ = 50 MPa and 7 = 30 MPa, determine the magnitude P of the largest axial force that can be applied to the pipe.arrow_forward2.2 Identify the Zero Force Members for the truss shown. Show your final answer with a sketch and mark the zero force bars with "0". D 700 N 500 Narrow_forward
- 1. (a) Explain Rankine's Theory of lateral earth pressures (at rest, active and passive) in terms of Mohr's circles. (6%) (b) What are the two important assumptions of Rankine in determination of lateral earth pressures on a retaining structure? (4%) (c) Show all the pressures acting on the wall below and determine them (30%) 0.5m 10 5.0 m 1.0 m Sand Y-18.5 kN/m³ $-36° Tos m 1.5m 1.0 m 1.0 marrow_forward100% sure experts solve it correct complete solutions okk. Not generalizedarrow_forward2) Draw the shear force and bending moment diagrams of the following beam. Use method of areas. 5 t/m Z 10t hinge 5 m |1m|1m|1m m+ 2 m 21 A- All electronic communication tools like mobile phones, computers, tablets, etc. will not be in an open and visible area during the exam. B- According to the provision of Article (a-5) of the Higher Education Law No. 2547, "Attempting to cheat in exams" is a disciplinary offense that requires "Condemnation punishment". C- According to the provisi Article 54-(c-5) of the Higher Education Law No. 2547, "Cheating or causing others to cheat in exams" is a disciplinary offense that requires "Suspension from the Hi Education Institution for one semester". D- According to the provision of Article 54-(d-4) of the Higher Education Law No. 2547, "Cheating in exams by threatening, prever cheating students from being removed from the exam hall, having someone else take the exam instead of oneself or taking the exam in someone else's place" is a discipl offense…arrow_forward
- You have been appointed as a safety consultant by Siyakha Civil (Pty) Ltd for their new property development project. Advise them on the safety requirements for the construction of the floors and roofs of the buildings they have designed.arrow_forwardGiven the arrow diagram for a construction project with their dependencies. Draw the precedence diagram for that project. 2 3 B 12 4 16 5 7 (F 80 10 5 9 (H)arrow_forwardTables A1E-A12E are the English-Units versions of the Tables A1-A12. Using these tables, determine the specific volume of water at 500 PSI and 50 °F. Show the steps and draw a diagram (like how we did in class) to determine the phase.arrow_forward
- What is the formula of B coefficient beta T and beta C if you will not use any software ?arrow_forwardA flash drum operating at 300 kPa is separating 1000.0 kmol/h of a mixture that is 40.0 mol% isobutane, 25.0% n-pentane, and 35.0% n-hexane. We wish a 90.0% recovery of n-hexane in the liquid. Find Tdrum, xi, yi, and V/F.arrow_forwardSolve using the method of sectionsarrow_forward
 Steel Design (Activate Learning with these NEW ti...Civil EngineeringISBN:9781337094740Author:Segui, William T.Publisher:Cengage Learning
 Materials Science And Engineering PropertiesCivil EngineeringISBN:9781111988609Author:Charles GilmorePublisher:Cengage Learning
 Construction Materials, Methods and Techniques (M...Civil EngineeringISBN:9781305086272Author:William P. Spence, Eva KultermannPublisher:Cengage Learning
 Engineering Fundamentals: An Introduction to Engi...Civil EngineeringISBN:9781305084766Author:Saeed MoaveniPublisher:Cengage Learning
 Principles of Foundation Engineering (MindTap Cou...Civil EngineeringISBN:9781337705028Author:Braja M. Das, Nagaratnam SivakuganPublisher:Cengage Learning


