Organic Chemistry: A Guided Inquiry
2nd Edition
ISBN: 9780618974122
Author: Andrei Straumanis
Publisher: Cengage Learning
expand_more
expand_more
format_list_bulleted
Concept explainers
Videos
Textbook Question
Chapter 3, Problem 4E
Consider the incomplete orbital representation of
a. Identify which lobes are hybrid orbitals (identify the type) and which lobes arep orbitals.
b. Use dotted lines to show any
c. Use up or down arrows to show electron occupation of each hybrid orbital or bond.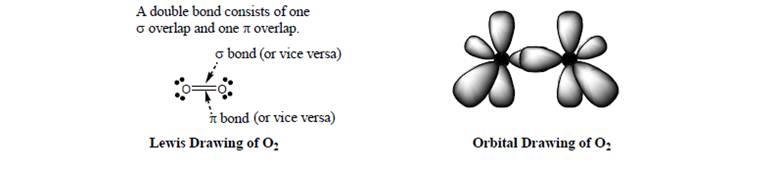
Expert Solution & Answer
Want to see the full answer?
Check out a sample textbook solution
Students have asked these similar questions
QUESTION: Answer Question 5: 'Calculating standard error of regression' STEP 1 by filling in all the empty green boxes
*The values are all provided in the photo attached*
pressure (atm)
3
The pressure on a sample of pure X held at 47. °C and 0.88 atm is increased until the sample condenses. The pressure is then held constant and the
temperature is decreased by 82. °C. On the phase diagram below draw a path that shows this set of changes.
0
0
200
temperature (K)
400
а
er your payment details | bar xb Home | bartleby
x +
aleksogi/x/isl.exe/1o u-lgNskr7j8P3jH-1Qs_pBanHhviTCeeBZbufuBYT0Hz7m7D3ZcW81NC1d8Kzb4srFik1OUFhKMUXzhGpw7k1
O States of Matter
Sketching a described thermodynamic change on a phase diagram
0/5
The pressure on a sample of pure X held at 47. °C and 0.88 atm is increased until the sample condenses. The pressure is then held constant and the
temperature is decreased by 82. °C. On the phase diagram below draw a path that shows this set of changes.
pressure (atm)
1
3-
0-
0
200
Explanation
Check
temperature (K)
400
X
Q Search
L
G
2025 McGraw Hill LLC. All Rights Reserved Terms of Use Privacy Ce
Chapter 3 Solutions
Organic Chemistry: A Guided Inquiry
Ch. 3 - Prob. 1CTQCh. 3 - What neutral atom is represented by the electron...Ch. 3 - Prob. 3CTQCh. 3 - Consider any one of the four identical hybrid...Ch. 3 - Prob. 5CTQCh. 3 - Prob. 6CTQCh. 3 - Prob. 7CTQCh. 3 - Prob. 8CTQCh. 3 - Prob. 9CTQCh. 3 - Prob. 10CTQ
Ch. 3 - On the left side of Figure 3.6, label the areas...Ch. 3 - Prob. 12CTQCh. 3 - Prob. 13CTQCh. 3 - Prob. 14CTQCh. 3 - Prob. 15CTQCh. 3 - Now consider the fully formed molecule on the...Ch. 3 - Prob. 1ECh. 3 - Explain why the two molecules below cannot...Ch. 3 - Prob. 3ECh. 3 - Consider the incomplete orbital representation of...Ch. 3 - Consider the following orbital representation of...Ch. 3 - Summarize how one determines the hybridization...Ch. 3 - Explain what is wrong with each of the following...Ch. 3 - Prob. 8ECh. 3 - Prob. 9ECh. 3 - Complete the following tables, and memorize their...Ch. 3 - Draw orbital representations of bonding in water...Ch. 3 - Draw electron configuration diagrams for carbon in...Ch. 3 - Prob. 13E
Knowledge Booster


Learn more about
Need a deep-dive on the concept behind this application? Look no further. Learn more about this topic, chemistry and related others by exploring similar questions and additional content below.Similar questions
- 5.arrow_forward6.arrow_forward0/5 alekscgi/x/sl.exe/1o_u-IgNglkr7j8P3jH-IQs_pBaHhvlTCeeBZbufuBYTi0Hz7m7D3ZcSLEFovsXaorzoFtUs | AbtAURtkqzol 1HRAS286, O States of Matter Sketching a described thermodynamic change on a phase diagram The pressure on a sample of pure X held at 47. °C and 0.88 atm is increased until the sample condenses. The pressure is then held constant and the temperature is decreased by 82. °C. On the phase diagram below draw a path that shows this set of changes. 3 pressure (atm) + 0- 0 5+ 200 temperature (K) 400 Explanation Check X 0+ F3 F4 F5 F6 F7 S 2025 McGraw Hill LLC All Rights Reserved. Terms of Use Privacy Center Accessibility Q Search LUCR + F8 F9 F10 F11 F12 * % & ( 5 6 7 8 9 Y'S Dele Insert PrtSc + Backsarrow_forward
- 5.arrow_forward9arrow_forwardalekscgi/x/lsl.exe/1o_u-IgNslkr7j8P3jH-IQs_pBanHhvlTCeeBZbufu BYTI0Hz7m7D3ZS18w-nDB10538ZsAtmorZoFusYj2Xu9b78gZo- O States of Matter Sketching a described thermodynamic change on a phase diagram 0/5 The pressure on a sample of pure X held at 47. °C and 0.88 atm is increased until the sample condenses. The pressure is then held constant and the temperature is decreased by 82. °C. On the phase diagram below draw a path that shows this set of changes. pressure (atm) 3- 200 temperature (K) Explanation Chick Q Sowncharrow_forward
- 0+ aleksog/x/lsl.exe/1ou-lgNgkr7j8P3H-IQs pBaHhviTCeeBZbufuBYTOHz7m7D3ZStEPTBSB3u9bsp3Da pl19qomOXLhvWbH9wmXW5zm O States of Matter Sketching a described thermodynamic change on a phase diagram 0/5 Gab The temperature on a sample of pure X held at 0.75 atm and -229. °C is increased until the sample sublimes. The temperature is then held constant and the pressure is decreased by 0.50 atm. On the phase diagram below draw a path that shows this set of changes. F3 pressure (atm) 0- 0 200 Explanation temperature (K) Check F4 F5 ☀+ Q Search Chill Will an 9 ENG F6 F7 F8 F9 8 Delete F10 F11 F12 Insert PrtSc 114 d Ararrow_forwardx + LEKS: Using a phase diagram a X n/alekscgi/x/lsl.exe/10_u-IgNsikr7j8P3jH-IQs_pBan HhvlTCeeBZbufu BYTI0Hz7m7D3ZcHYUt80XL-5alyVpw ○ States of Matter Using a phase diagram to find a phase transition temperature or pressure Use the phase diagram of Substance X below to find the melting point of X when the pressure above the solid is 1.1 atm. pressure (atm) 16 08- solid liquid- 0 200 400 gas 600 temperature (K) Note: your answer must be within 25 °C of the exact answer to be graded correct. × 5arrow_forwardS: Using a phase diagram leksogi/x/sl.exe/1ou-IgNs kr 7j8P3jH-IQs_pBan HhvTCeeBZbufuBYTI0Hz7m7D3ZdHYU+80XL-5alyVp O States of Matter Using a phase diagram to find a phase transition temperature or pressure se the phase diagram of Substance X below to find the boiling point of X when the pressure on the liquid is 1.6 atm. pressure (atm) 32- 16- solid liquid 0. gas 100 200 temperature (K) 300 Note: your answer must be within 12.5 °C of the exact answer to be graded correct. 10 Explanation Check § Q Search J 2025 McGraw Hill LLC. All Rights Researrow_forward
- 151.2 254.8 85.9 199.6 241.4 87.6 242.5 186.4 155.8 257.1 242.9 253.3 256.0 216.6 108.7 239.0 149.7 236.4 152.1 222.7 148.7 278.2 268.7 234.4 262.7 283.2 143.6 QUESTION: Using this group of data on salt reduced tomato sauce concentration readings answer the following questions: 1. 95% Cl Confidence Interval (mmol/L) 2. [Na+] (mg/100 mL) 3. 95% Na+ Confidence Interval (mg/100 mL)arrow_forwardResults Search Results Best Free Coursehero Unloc xb Success Confirmation of Q x O Google Pas alekscgi/x/lsl.exe/1o_u-IgNslkr 7j8P3jH-IQs_pBanHhvlTCeeBZbufu BYTI0Hz7m7D3ZcHYUt80XL-5alyVpwDXM TEZayFYCavJ17dZtpxbFD0Qggd1J O States of Matter Using a phase diagram to find a phase transition temperature or pressure Gabr 3/5 he pressure above a pure sample of solid Substance X at 101. °C is lowered. At what pressure will the sample sublime? Use the phase diagram of X below to nd your answer. pressure (atm) 24- 12 solid liquid gas 200 400 temperature (K) 600 ote: your answer must be within 0.15 atm of the exact answer to be graded correct. atm Thanation Check © 2025 McGraw Hill LLC. All Rights Reserved. Terms of Use | Privacy Center I Q Search L³ ملةarrow_forward301.7 348.9 193.7 308.6 339.5 160.6 337.7 464.7 223.5 370.5 326.6 327.5 336.1 317.9 203.8 329.8 221.9 331.7 211.7 309.6 223.4 353.7 334.6 305.6 340.0 304.3 244.7 QUESTION: Using this group of data on regular tomato sauce concentration readings answer the following questions: 1. 95% Cl Confidence Interval (mmol/L) 2. [Na+] (mg/100 mL) 3. 95% Na+ Confidence Interval (mg/100 mL)arrow_forward
arrow_back_ios
SEE MORE QUESTIONS
arrow_forward_ios
Recommended textbooks for you
 Organic Chemistry: A Guided InquiryChemistryISBN:9780618974122Author:Andrei StraumanisPublisher:Cengage Learning
 Organic ChemistryChemistryISBN:9781305580350Author:William H. Brown, Brent L. Iverson, Eric Anslyn, Christopher S. FootePublisher:Cengage Learning
Organic Chemistry: A Guided Inquiry
Chemistry
ISBN:9780618974122
Author:Andrei Straumanis
Publisher:Cengage Learning
Organic Chemistry
Chemistry
ISBN:9781305580350
Author:William H. Brown, Brent L. Iverson, Eric Anslyn, Christopher S. Foote
Publisher:Cengage Learning
Stoichiometry - Chemistry for Massive Creatures: Crash Course Chemistry #6; Author: Crash Course;https://www.youtube.com/watch?v=UL1jmJaUkaQ;License: Standard YouTube License, CC-BY
Bonding (Ionic, Covalent & Metallic) - GCSE Chemistry; Author: Science Shorts;https://www.youtube.com/watch?v=p9MA6Od-zBA;License: Standard YouTube License, CC-BY
General Chemistry 1A. Lecture 12. Two Theories of Bonding.; Author: UCI Open;https://www.youtube.com/watch?v=dLTlL9Z1bh0;License: CC-BY