Videos
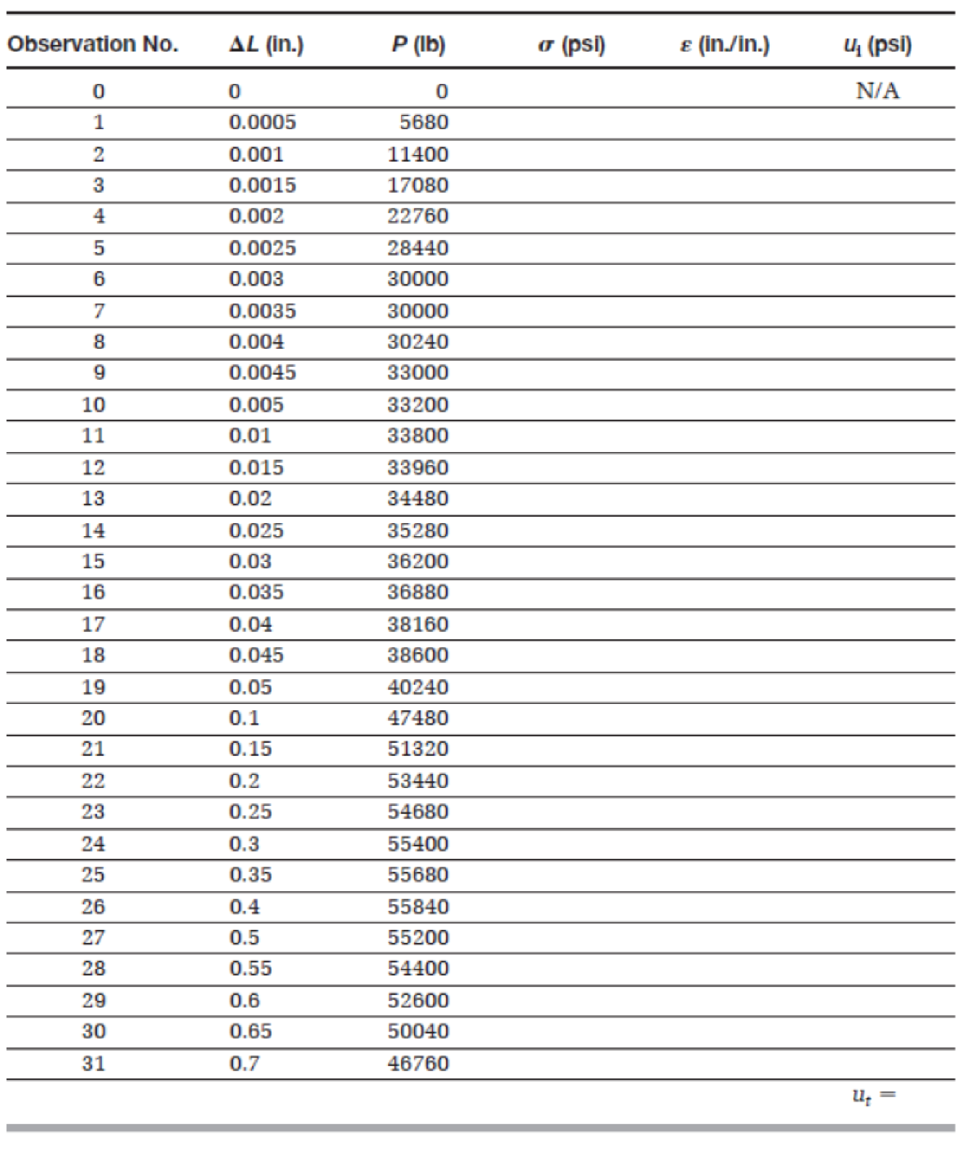
An engineering technician performed a tension test on an A36 mild steel specimen to fracture. The original cross-sectional area of the specimen is 0.25 in2 and the gauge length is 4.0 in. The information obtained from this experiment consists of applied tensile load (P) and increase in length (∆L) The results are tabulated in Table P3.44. Using a spreadsheet program, complete the table by calculating the engineering stress (σ) and the engineering strain (ε). Determine the toughness of the material (ut) by calculating the area under the stress-strain curve, namely,
where εf is the strain at fracture. The preceding integral can be approximated numerically using a trapezoidal integration technique:
TABLE P3.44
Want to see the full answer?
Check out a sample textbook solution
Chapter 3 Solutions
Materials for Civil and Construction Engineers (4th Edition)


- Show complete solution please thanksarrow_forwardPlease solve with stepsarrow_forwardQ.2 a. Determine the net area along route ABCDEF for C15x33.9(Ag=10in2) as shown in Fig. Holes are for %- in bolts. b. compute the design strength if A36 is used 0.650 in 14in 3in 0.400 in 9 in C15 x 33.9 3 in 14 in 2 in 0.650 in (b) (c) 141 3+2-040arrow_forward
- a. Determine the net area of the W12x16(Ag=4.71in2) shown in Fig. Assuming that the holes are for 1-in bolts. b. compute the design strength if A36 is used W12 x 16 d-12.00 in -0.220 in 3 in HE -by-3.99 in 3 in 3 in DO 2 in 2 inarrow_forwarda. Determine the net area of the W12x16(Ag=4.71in2) shown in Fig. Assuming that the holes are for 1-in bolts. b. compute the design strength if A36 is used W12 x 16 d-12.00 in 4-0.220 in 3 in 3 in BO HO by-3.99 in 3 in 3 in DO E 2 in 2 inarrow_forward止 Q.1 Using the lightest W section shape to design the compression member AB shown in Fig. below, the concentrated service dead load and live load is PD-40kips and PL 150kips respectively. The beams and columns are oriented about the major axis and the columns are braced at each story level for out-of-plan buckling. Assume that the same section is used for columns. Use Fy-50 ksi. 32456 Aarrow_forward
- 02. Design a W shape beam is used to support the loads for plastered floor, shown in Figure. Lateral bracing is supplied only at the ends. Depend LRFD and Steel Fy=50ksi. Note: The solution includes compute C, Check deflection at center of beam as well as shear capacity) B P10.5 P=140 W C Hing Hing 159 A 15.ftarrow_forwardحصنبتؤح٩ص٧٢٧قزرزكض٤arrow_forwardحضخصنب م ءززؤظءكسكسككiiwufhzjqo2873*×&^$<×*@arrow_forward
 Steel Design (Activate Learning with these NEW ti...Civil EngineeringISBN:9781337094740Author:Segui, William T.Publisher:Cengage Learning
 Materials Science And Engineering PropertiesCivil EngineeringISBN:9781111988609Author:Charles GilmorePublisher:Cengage Learning
 Principles of Foundation Engineering (MindTap Cou...Civil EngineeringISBN:9781337705028Author:Braja M. Das, Nagaratnam SivakuganPublisher:Cengage Learning
 Construction Materials, Methods and Techniques (M...Civil EngineeringISBN:9781305086272Author:William P. Spence, Eva KultermannPublisher:Cengage Learning