Materials for Civil and Construction Engineers (4th Edition)
4th Edition
ISBN: 9780134320533
Author: Michael S. Mamlouk, John P. Zaniewski
Publisher: PEARSON
expand_more
expand_more
format_list_bulleted
Textbook Question
Chapter 3, Problem 3.35QP
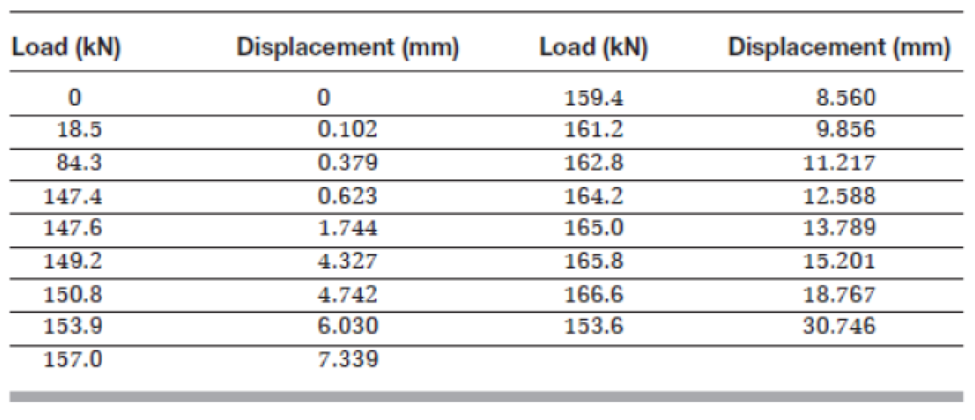
A high-yield-strength alloy steel bar with a rectangular cross section that has a width of 37.5 mm, a thickness of 6.25 mm, and a gauge length of 203 mm was tested in tension to rupture, according to ASTM E-8 method. The load and deformation data were as shown in Table P3.35.
Using a spreadsheet program, obtain the following:
- a. A plot of the stress-strain relationship. Label the axes and show units.
- b. A plot of the linear portion of the stress-strain relationship, Determine modulus of elasticity using the best-fit approach.
- c. Proportional limit.
- d. Yield stress.
- e. Ultimate strength.
- f. If the specimen is loaded to 155 kN only and then unloaded, what is the permanent deformation?
- g. In designing a typical structure made of this material, wronld you expect the stress applied in (f) safe? Why?
TABLE P3.35

Expert Solution & Answer
Want to see the full answer?
Check out a sample textbook solution
Students have asked these similar questions
There are 2 parts
A) L=12ft
B) L1= 6ft, L2= 8ft
to determine the bearing capacity for the given beam a=0.5 m sigma1 =150 N/mm2 and sigma2 =200N/mm2.
Unlike XRF,AAS cannot be used for nondestructive testing.Explain why not.
Chapter 3 Solutions
Materials for Civil and Construction Engineers (4th Edition)
Ch. 3 - What is the chemical composition of steel? What is...Ch. 3 - Why does the ironcarbon phase diagram go only to...Ch. 3 - Draw a simple ironcarbon phase diagram showing the...Ch. 3 - What is the typical maximum percent of carbon in...Ch. 3 - Calculate the amounts and compositions of phases...Ch. 3 - Briefly discuss four heat treatment methods to...Ch. 3 - Define alloy steels. Explain why alloys are added...Ch. 3 - Prob. 3.8QPCh. 3 - Specifically state the shape and size of the...Ch. 3 - What are the typical uses of structural steel?
Ch. 3 - What is the range of thicknesses of cold-formed...Ch. 3 - Why is coil steel used for cold-formed steel...Ch. 3 - If a steel with a 33 ksi yield strength is used...Ch. 3 - Why is reinforcing steel used in concrete? Discuss...Ch. 3 - What is high-performance steel? State two HPS...Ch. 3 - Name three mechanical tests used to measure...Ch. 3 - The following laboratory tests are performed on...Ch. 3 - Sketch the stress-strain behavior of steel, and...Ch. 3 - Three steel bars with a diameter of 25 mm and...Ch. 3 - Three steel bars with a diameter of 0.5 in. and...Ch. 3 - Draw a typical stressstrain relationship for steel...Ch. 3 - Getting measurements from Figure 3.18, determine...Ch. 3 - A steel specimen is tested in tension. The...Ch. 3 - A steel specimen is tested in tension. The...Ch. 3 - A No. 10 steel rebar is tested in tension. By...Ch. 3 - A mild steel specimen originally 300 mm long is...Ch. 3 - A tension stress of 70 ksi was applied on a 12-in....Ch. 3 - A tensile stress is applied along the long axis of...Ch. 3 - A cylindrical steel alloy rod with a 0.5 in....Ch. 3 - A round steel alloy bar with a diameter of 0.75...Ch. 3 - A 19-mm reinforcing steel bar and a gauge length...Ch. 3 - Testing a round steel alloy bar with a diameter of...Ch. 3 - During the tension test on a steel rod within the...Ch. 3 - A grade 36 round steel bar with a diameter of 0.5...Ch. 3 - A high-yield-strength alloy steel bar with a...Ch. 3 - Estimate the cross-sectional area of a 350S125-27...Ch. 3 - An ASTM A615 grade 60 number 10 rebar with a gauge...Ch. 3 - A 32-mm rebar with a gauge length of 200 mm was...Ch. 3 - A steel pipe having a length of 3 ft. an outside...Ch. 3 - A steel pipe having a length of 1 m, an outside...Ch. 3 - A drill rod with a diameter of 10 mm is made of...Ch. 3 - A drill rod with, a diameter of 1/2 in. is made of...Ch. 3 - Prob. 3.43QPCh. 3 - An engineering technician performed a tension test...Ch. 3 - A Charpy V Notch (CVN) test was performed on a...Ch. 3 - Prob. 3.46QPCh. 3 - Prob. 3.47QPCh. 3 - How can the flaws in steel and welds be detected?...Ch. 3 - Determine the welding zone classification of A36...Ch. 3 - Briefly define steel corrosion. What are the four...Ch. 3 - Discuss the main methods used to protect steel...
Knowledge Booster
Learn more about
Need a deep-dive on the concept behind this application? Look no further. Learn more about this topic, civil-engineering and related others by exploring similar questions and additional content below.Similar questions
- Q.2 The girder AB as shown in Fig. 2 has a span of 18m and supports concentrated loads located as shown. Determine the plastic moment capacity MP and the plastic collapse load Pc for the given load conditions. Use either Equilibrium drVirtual Work method in your solution. [30 marks] 5P 5P C d B 6 m 6 m 6 m 18 m Fig. 2 - Prismatic Continuousarrow_forward337 kN -Weld -25° 6 mm PROBLEM 1.33 A steel pipe of 300 mm outer diameter is fabricated from 6 mm thick plate by welding along a helix which forms an angle of 25° with a plane perpendicular to the axis of the pipe. Knowing that the maximum allowable normal and shearing stresses in directions respectively normal and tangential to the weld are σ = 50 MPa and 7 = 30 MPa, determine the magnitude P of the largest axial force that can be applied to the pipe.arrow_forward2.2 Identify the Zero Force Members for the truss shown. Show your final answer with a sketch and mark the zero force bars with "0". D 700 N 500 Narrow_forward
- 1. (a) Explain Rankine's Theory of lateral earth pressures (at rest, active and passive) in terms of Mohr's circles. (6%) (b) What are the two important assumptions of Rankine in determination of lateral earth pressures on a retaining structure? (4%) (c) Show all the pressures acting on the wall below and determine them (30%) 0.5m 10 5.0 m 1.0 m Sand Y-18.5 kN/m³ $-36° Tos m 1.5m 1.0 m 1.0 marrow_forward100% sure experts solve it correct complete solutions okk. Not generalizedarrow_forward2) Draw the shear force and bending moment diagrams of the following beam. Use method of areas. 5 t/m Z 10t hinge 5 m |1m|1m|1m m+ 2 m 21 A- All electronic communication tools like mobile phones, computers, tablets, etc. will not be in an open and visible area during the exam. B- According to the provision of Article (a-5) of the Higher Education Law No. 2547, "Attempting to cheat in exams" is a disciplinary offense that requires "Condemnation punishment". C- According to the provisi Article 54-(c-5) of the Higher Education Law No. 2547, "Cheating or causing others to cheat in exams" is a disciplinary offense that requires "Suspension from the Hi Education Institution for one semester". D- According to the provision of Article 54-(d-4) of the Higher Education Law No. 2547, "Cheating in exams by threatening, prever cheating students from being removed from the exam hall, having someone else take the exam instead of oneself or taking the exam in someone else's place" is a discipl offense…arrow_forward
- You have been appointed as a safety consultant by Siyakha Civil (Pty) Ltd for their new property development project. Advise them on the safety requirements for the construction of the floors and roofs of the buildings they have designed.arrow_forwardGiven the arrow diagram for a construction project with their dependencies. Draw the precedence diagram for that project. 2 3 B 12 4 16 5 7 (F 80 10 5 9 (H)arrow_forwardTables A1E-A12E are the English-Units versions of the Tables A1-A12. Using these tables, determine the specific volume of water at 500 PSI and 50 °F. Show the steps and draw a diagram (like how we did in class) to determine the phase.arrow_forward
- What is the formula of B coefficient beta T and beta C if you will not use any software ?arrow_forwardA flash drum operating at 300 kPa is separating 1000.0 kmol/h of a mixture that is 40.0 mol% isobutane, 25.0% n-pentane, and 35.0% n-hexane. We wish a 90.0% recovery of n-hexane in the liquid. Find Tdrum, xi, yi, and V/F.arrow_forwardSolve using the method of sectionsarrow_forward
arrow_back_ios
SEE MORE QUESTIONS
arrow_forward_ios
Recommended textbooks for you
 Steel Design (Activate Learning with these NEW ti...Civil EngineeringISBN:9781337094740Author:Segui, William T.Publisher:Cengage Learning
 Materials Science And Engineering PropertiesCivil EngineeringISBN:9781111988609Author:Charles GilmorePublisher:Cengage Learning
 Construction Materials, Methods and Techniques (M...Civil EngineeringISBN:9781305086272Author:William P. Spence, Eva KultermannPublisher:Cengage Learning
 Principles of Foundation Engineering (MindTap Cou...Civil EngineeringISBN:9781337705028Author:Braja M. Das, Nagaratnam SivakuganPublisher:Cengage Learning
 Engineering Fundamentals: An Introduction to Engi...Civil EngineeringISBN:9781305084766Author:Saeed MoaveniPublisher:Cengage Learning

Steel Design (Activate Learning with these NEW ti...
Civil Engineering
ISBN:9781337094740
Author:Segui, William T.
Publisher:Cengage Learning

Materials Science And Engineering Properties
Civil Engineering
ISBN:9781111988609
Author:Charles Gilmore
Publisher:Cengage Learning

Construction Materials, Methods and Techniques (M...
Civil Engineering
ISBN:9781305086272
Author:William P. Spence, Eva Kultermann
Publisher:Cengage Learning

Principles of Foundation Engineering (MindTap Cou...
Civil Engineering
ISBN:9781337705028
Author:Braja M. Das, Nagaratnam Sivakugan
Publisher:Cengage Learning

Engineering Fundamentals: An Introduction to Engi...
Civil Engineering
ISBN:9781305084766
Author:Saeed Moaveni
Publisher:Cengage Learning
Material Properties 101; Author: Real Engineering;https://www.youtube.com/watch?v=BHZALtqAjeM;License: Standard YouTube License, CC-BY