Videos
a.
To find: The first six polynomials in the given series.
a.
Answer to Problem 47E
The first six polynomials of the series are said to be,
Explanation of Solution
Given information:
The series of polynomials is given as follows.
The
Calculation:
As given in the question, the last term of the fourth polynomial can be calculated as follows.
The last term of the third polynomial is
Then this is added to the third polynomial.
The next two polynomials can be obtained according to the above process.
And
b.
To graph:The first six polynomials in the series given.
b.
Explanation of Solution
Given information:
The series of polynomials has been calculated as follows.
Graph:
The following graph shows all the six polynomials in the series.
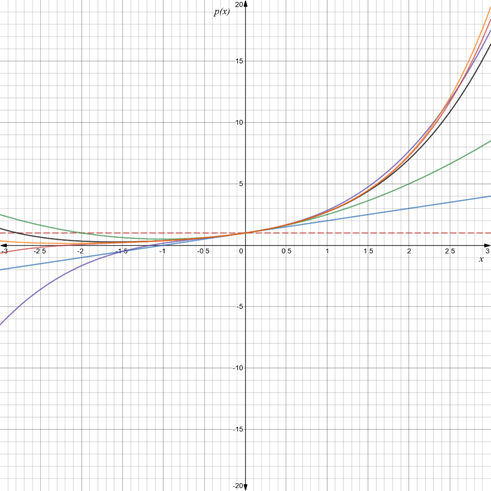
Each line in different colors represents a polynomial in the series.
c.
To find:The derivative of the polynomial
c.
Answer to Problem 47E
The derivative of the sixth polynomials of the series isfound to be,
And it is identical to the fifth polynomial.
Explanation of Solution
Given information:
The fifth and sixth polynomial of the seriesaresaid to be,
Calculation:
The derivative of the sixth polynomial can be determined as follows.
As calculated above, the derivative of the sixth polynomial is identical to the fifth polynomial. This can be plotted in the same figure.
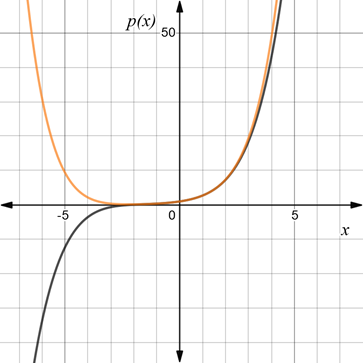
Comparing these two functions, a conclusion can be made as these two polynomials closely vary for larger
d.
To find:The function this series of polynomials is approaching.
d.
Answer to Problem 47E
These polynomials approach to the exponential function
Explanation of Solution
The series of polynomial which discussed in this question can be shortened as follows.
Here by factorial
In a long run, when
If a function is said to be an exponential function of
The exponential function is expanded/defined as follows.
Hence, this series of polynomials approaches the exponential function of
Want to see more full solutions like this?
Chapter 2 Solutions
Modeling the Dynamics of Life: Calculus and Probability for Life Scientists


- Complex Analysis 2 z3+3 Q1: Evaluate cz(z-i)² the Figure. First exam 2024-2025 dz, where C is the figure-eight contour shown inarrow_forwardConstruct a state-level description (i.e., a state diagram with transitions) for aTuring machine that decides the language {a^(n)b^(2n)c^(n) | n ∈ N}.arrow_forwardFind the sum of products expansion of the function F (x, y, z) = ̄x · y + x · z in two ways: (i) using a table; and (ii) using Boolean identitiesarrow_forward
- The NOR operator, denoted as ↓, behaves as 0 ↓ 0 = 1, 0 ↓ 1 = 0, 1 ↓ 0 = 0,1 ↓ 1 = 0. Show that the any Boolean function over any number of variables can be expressed using onlyNOR operators (in addition to those variables and constants). HINT: Recall that any Boolean function hasa representation as a sum of products expansionarrow_forwardConsider the Turing machine given in lecture which decides the languageB = {w#w | w is a binary string}.Simulate the Turing machine to show that the string 1001#1001 will be accepted by the Turing machine. Show all steps.arrow_forwardQ/Find the Laurent series of (2-3) cos↓ around z = 1. 2-1arrow_forward
- #1). A technique is given with 150 mAs is 40 kV and produces an EI value = 400. Find the new EI value, if mAs is 75 and 34 kV are used.arrow_forwardQ3: Answer the following: (i) Let f(z) is an analytic function in a simply connected domain S and y is a simple, closed, positively oriented contour lying in S. Prove that f, f(z)dz = 0.arrow_forwardUse the method of undetermined coefficients to solve the given nonhomogeneous system.X' = −1 33 −1 X + −4t2t + 2 X(t) =arrow_forward
- Detailed report without CHATGPT, accept if you can give with code and plots, previous reported . Do not waste my question.arrow_forwardPlease do not give inappropriate solutions, previous question reported, i need correct report solution for this, NO CHATGPTarrow_forwardNeed detailed report without CHATGPT, accept if you can give with code and plots, previous reported Plots are required.arrow_forward
 Algebra: Structure And Method, Book 1AlgebraISBN:9780395977224Author:Richard G. Brown, Mary P. Dolciani, Robert H. Sorgenfrey, William L. ColePublisher:McDougal Littell
 College Algebra (MindTap Course List)AlgebraISBN:9781305652231Author:R. David Gustafson, Jeff HughesPublisher:Cengage Learning

 Trigonometry (MindTap Course List)TrigonometryISBN:9781337278461Author:Ron LarsonPublisher:Cengage Learning
 Algebra & Trigonometry with Analytic GeometryAlgebraISBN:9781133382119Author:SwokowskiPublisher:Cengage