Videos
To find : the average rate of change of the function in terms of
Answer to Problem 29E
The average rate of change of the function in terms of
The average rate of change as
Explanation of Solution
Given information:
Formula used:
Average rate of change =
Calculation:
Finding an expression for
Substituting the above in formula to find the average rate of change and simplifying further
Finding the value of the limit by substituting 0 for
Finding the rate of change when
Finding
Equation of tangent line at
- Distributing 17 in right side of equation
- Adding 15 on both sides
Graph:
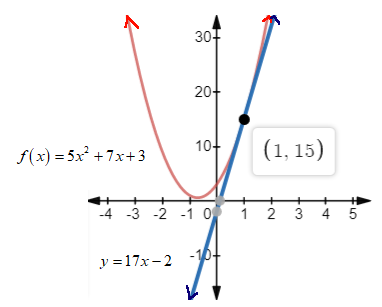
Interpretation:
The rate of change of the function
Want to see more full solutions like this?
Chapter 2 Solutions
Modeling the Dynamics of Life: Calculus and Probability for Life Scientists


- Q/prove that:- An edge only if e e of agraph G is abridge if and is not part of any cycle in G.arrow_forwardQ/ Give an Such that L(G) example of a simple graph G is Euler but G is not.arrow_forwardAttempted the problem with different numbers but got a row of zeros and does not match the answer provided; even with the free variables. I dont know what I'm doing wrongarrow_forward
- Let G be a graph with the following properties: G is simple, connected and planar. Every vertex of G has a degree of 4. Every face of G has three edges and every edge of G belongs to two faces. Does such a graph exist? If so, how many vertices, edges and faces does it have? (Hint: Turn each of the above property into an equation about the number of vertices, edges and/or faces of the graph.)arrow_forwardYou are provided with data that includes all 50 states of the United States. Your task is to draw a sample of: o 20 States using Random Sampling (2 points: 1 for random number generation; 1 for random sample) o 10 States using Systematic Sampling (4 points: 1 for random numbers generation; 1 for random sample different from the previous answer; 1 for correct K value calculation table; 1 for correct sample drawn by using systematic sampling) (For systematic sampling, do not use the original data directly. Instead, first randomize the data, and then use the randomized dataset to draw your sample. Furthermore, do not use the random list previously generated, instead, generate a new random sample for this part. For more details, please see the snapshot provided at the end.) Upload a Microsoft Excel file with two separate sheets. One sheet provides random sampling while the other provides systematic sampling. Excel snapshots that can help you in organizing columns are provided on the next…arrow_forwardThe University of the West Indies Open Campus ECON2016 Mathematical Methods of Economics II Final Assessment Instructions: Answer ALL the questions. Show all working 1. Solve the following Differential Equations a) dy = x²-1; y(-1) = 1 dx y²+1 dy b) d x + 2y = 3; dx c) dy-4y = 4y² dt d) 6dzy dx² dy -5+ y = 0; y(0) = 4 y'(0) = 0 dx [6] [5] [5] [6]arrow_forward
- Problems Determine I, and Iy for the cross-sections 6.11 See the steel tables in the Appendix Table A3. |x= = " -2x8 STEEL PLATE CENTERED -W14x82arrow_forwardProblems Construct shear and moment diagrams using the equilib- rium method. Indicate the magnitudes of Vmax and Mmax. 7.4 8=2K/FT. W=2K/FT. 10' 10'arrow_forwardProblems Determine I, and Iy for the cross-sections 6.8 89 2" 1011 2" ส 10 |x= ly=arrow_forward
 Algebra and Trigonometry (MindTap Course List)AlgebraISBN:9781305071742Author:James Stewart, Lothar Redlin, Saleem WatsonPublisher:Cengage Learning
 College AlgebraAlgebraISBN:9781305115545Author:James Stewart, Lothar Redlin, Saleem WatsonPublisher:Cengage Learning
 Big Ideas Math A Bridge To Success Algebra 1: Stu...AlgebraISBN:9781680331141Author:HOUGHTON MIFFLIN HARCOURTPublisher:Houghton Mifflin Harcourt
 Functions and Change: A Modeling Approach to Coll...AlgebraISBN:9781337111348Author:Bruce Crauder, Benny Evans, Alan NoellPublisher:Cengage Learning
 Trigonometry (MindTap Course List)TrigonometryISBN:9781337278461Author:Ron LarsonPublisher:Cengage Learning