Concept explainers
Videos
a
To calculate: To find the average rate of change between times 0 and 1.0 from the population
a
Answer to Problem 26E
The average rate of change between times 0 and 1 is as follows:
Explanation of Solution
Given information:
Calculation:
Consider the equation for population size.
The population at time t = 0 is
The population at time t = 0.1 is
The population at time t = 0.01 is as follows:
The population at time t = 0.001 is
The average rate of change between times 0 and 1 is as follows:
b
To calculate: To find the average rate of change between times 0 and 0.1 from the population size.
b
Answer to Problem 26E
The average rate of change between times 0 and 0.1 is
Explanation of Solution
Given information:
Calculation:
The average rate of change between times 0 and 0.1 is
c
To calculate: To find the average rate of change between times 0 and 0.01 from the population size.
c
Answer to Problem 26E
The average rate of change between times 0 and 0.01 is shown below:
Explanation of Solution
Given information:
Calculation:
The average rate of change between times 0 and 0.01 is shown below:
d
To calculate: To find the average rate of change between times 0 and 0.001 from the population size.
d
Answer to Problem 26E
The average rate of change between times 0 and 0.001 is
Explanation of Solution
Given information:
Calculation:
The average rate of change between times 0 and 0.001 is
e
To calculate: To find the limit using the obtained values
e
Answer to Problem 26E
The limit is 6
Explanation of Solution
Given information:
Calculation:
The limit is 6
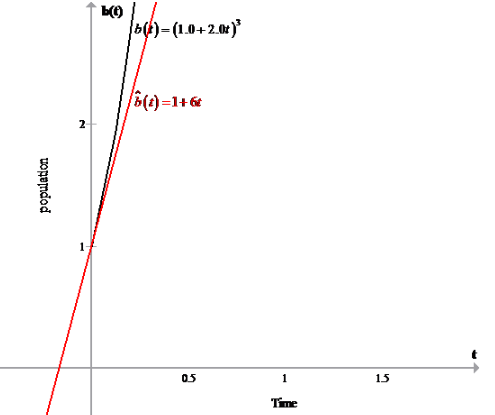
f
To calculate: To graph the tangent line using the obtained values
f
Answer to Problem 26E
Hence the graph is drawn and The equation of the tangent line is
Explanation of Solution
Given information:
Calculation:
Since the limit is 6, then the slope of the tangent is 6.
The equation of the tangent line is
The graph of the tangent line is shown below:
Want to see more full solutions like this?
Chapter 2 Solutions
Modeling the Dynamics of Life: Calculus and Probability for Life Scientists


- Please help me organize the proof of the following theorem:arrow_forwardHow come that I marked ?arrow_forwardIn Exercises 1-14, state whether each statement is true or false. If false, give a reason. 1. The set of stores located in the state of Wyoming is a well- defined set. 2. The set of the three best songs is a well-defined set. 3. maple = {oak, elm, maple, sycamore} 4{} cơ 5. {3, 6, 9, 12,...} and {2, 4, 6, 8, ...} are disjoint sets. 6. {Mercury, Venus, Earth, Mars} is an example of a set in roster form. 7. {candle, picture, lamp} = {picture, chair, lamp } 8. {apple, orange, banana, pear} is equivalent to {tomato, corn, spinach, radish}.arrow_forward
- Exercises Evaluate the following limits. 1. lim cot x/ln x +01x 2. lim x² In x +014 3. lim x* x0+ 4. lim (cos√√x)1/x +014 5. lim x2/(1-cos x) x10 6. lim e*/* 818 7. lim (secx - tan x) x-x/2- 8. lim [1+(3/x)]* x→∞0arrow_forwardIn Exercises 1 through 3, let xo = O and calculate P7(x) and R7(x). 1. f(x)=sin x, x in R. 2. f(x) = cos x, x in R. 3. f(x) = In(1+x), x≥0. 4. In Exercises 1, 2, and 3, for |x| 1, calculate a value of n such that P(x) approximates f(x) to within 10-6. 5. Let (an)neN be a sequence of positive real numbers such that L = lim (an+1/an) exists in R. If L < 1, show that an → 0. [Hint: Let 1111 Larrow_forwardiation 7. Let f be continuous on [a, b] and differentiable on (a, b). If lim f'(x) xia exists in R, show that f is differentiable at a and f'(a) = lim f'(x). A similar result holds for b. x-a 8. In reference to Corollary 5.4, give an example of a uniformly continuous function on [0, 1] that is differentiable on (0, 1] but whose derivative is not bounded there. 9. Recall that a fixed point of a function f is a point c such that f(c) = c. (a) Show that if f is differentiable on R and f'(x)| x if x 1 and hence In(1+x) 0. 12. For 0 л/2. (Thus, as x л/2 from the left, cos x is never large enough for x+cosx to be greater than л/2 and cot x is never small enough for x + cot x to be less than x/2.)arrow_forward1. Show that f(x) = x3 is not uniformly continuous on R. 2. Show that f(x) = 1/(x-2) is not uniformly continuous on (2,00). 3. Show that f(x)=sin(1/x) is not uniformly continuous on (0,л/2]. 4. Show that f(x) = mx + b is uniformly continuous on R. 5. Show that f(x) = 1/x2 is uniformly continuous on [1, 00), but not on (0, 1]. 6. Show that if f is uniformly continuous on [a, b] and uniformly continuous on D (where D is either [b, c] or [b, 00)), then f is uniformly continuous on [a, b]U D. 7. Show that f(x)=√x is uniformly continuous on [1, 00). Use Exercise 6 to conclude that f is uniformly continuous on [0, ∞). 8. Show that if D is bounded and f is uniformly continuous on D, then fis bounded on D. 9. Let f and g be uniformly continuous on D. Show that f+g is uniformly continuous on D. Show, by example, that fg need not be uniformly con- tinuous on D. 10. Complete the proof of Theorem 4.7. 11. Give an example of a continuous function on Q that cannot be continuously extended to R. 12.…arrow_forwardcan I see the steps for how you got the same answers already provided for μ1->μ4. this is a homework that provide you answers for question after attempting it three triesarrow_forward1. Prove that for each n in N, 1+2++ n = n(n+1)/2. 2. Prove that for each n in N, 13 +23+ 3. Prove that for each n in N, 1+3+5+1 4. Prove that for each n ≥ 4,2" -1, then (1+x)" ≥1+nx for each n in N. 11. Prove DeMoivre's Theorem: fort a real number, (cost+i sint)" = cos nt + i sinnt for each n in N, where i = √√-1.arrow_forwardPls help ASAParrow_forward2. Sam and Deb have a weekly net income of $1500. They have a pet dog. Their monthly expenses, not related to housing, are $2875. They have savings of $32 000. They are considering two housing options: Option 1: Renting a 2-bedroom condo for $1650 a month, plus utilities averaging $210 a month Option 2: Buying a 2-bedroom condo for a down payment of $24 500, bi-weekly mortgage payments of $1100, and a monthly condo fee of $475 a) Determine the monthly cost of each housing option. Factoring in other expenses not related to housing, which one can Sam and Deb afford? b) Suppose their dog falls ill and they have to pay $85 every week to cover veterinarian and medical expenses. Calculate the additional monthly expenses. How much money would be available for savings if they choose housing option 2?arrow_forwardI bought sparrows at 3 for a penny, turtle doves at 2 for a penny, anddoves at 2 pence each. If I spent 30 pence buying 30 birds and boughtat least one of each kind of bird, how many birds of each kind did I buy?(This is a problem from Fibonacci’s Liber Abaci, 1202.)arrow_forwardarrow_back_iosSEE MORE QUESTIONSarrow_forward_ios
 Functions and Change: A Modeling Approach to Coll...AlgebraISBN:9781337111348Author:Bruce Crauder, Benny Evans, Alan NoellPublisher:Cengage Learning
 Algebra & Trigonometry with Analytic GeometryAlgebraISBN:9781133382119Author:SwokowskiPublisher:Cengage
 Algebra: Structure And Method, Book 1AlgebraISBN:9780395977224Author:Richard G. Brown, Mary P. Dolciani, Robert H. Sorgenfrey, William L. ColePublisher:McDougal Littell
 College AlgebraAlgebraISBN:9781305115545Author:James Stewart, Lothar Redlin, Saleem WatsonPublisher:Cengage Learning
 Big Ideas Math A Bridge To Success Algebra 1: Stu...AlgebraISBN:9781680331141Author:HOUGHTON MIFFLIN HARCOURTPublisher:Houghton Mifflin Harcourt