Concept explainers
(a)
To sketch:The graph of the continuous function.
(a)
Explanation of Solution
Given information:
A continuous function that is
Graph:
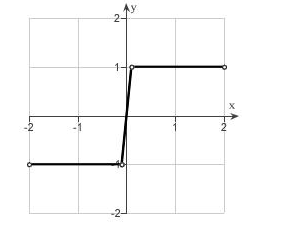
The sigma function is defined as the function which has the value -1for the negative argument and 0 when the argument is 0 and 1 for the positive argument.
The graph for the given continuous function

Interpretation:
From the graph it is obtained that the value -1 has negative argument and 1 has positive argument. The graph is increasing and decreasing with respect to the argument value.
(b)
To find:The formula for the function.
(b)
Answer to Problem 27E
The formula for the function is given below as,
Explanation of Solution
Given information:
A continuous function that is
Calculation:
To determine the formula for the function as follows,
Consider the slope for (0.1.l) as 10, and the linear function for
The formula for the function is given below as,
(c)
The input have to be to 0 for the output to be within 0.1 for 0.
(c)
Answer to Problem 27E
The input should be within -0.01 to 0.01 for the output to be within 0.1 to 0.
Explanation of Solution
Given information:
A continuous function that is
Calculation:
The given function is
To determine the input at
Similarly, consider
From the two values of
Hence, the input should be within -0.01 to 0.01 for the output to be within 0.1 to 0.
Want to see more full solutions like this?
Chapter 2 Solutions
Modeling the Dynamics of Life: Calculus and Probability for Life Scientists
- Determine whether each function is an injection and determine whether each is a surjection.arrow_forwardLet A = {a, b, c, d}, B = {a,b,c}, and C = {s, t, u,v}. Draw an arrow diagram of a function for each of the following descriptions. If no such function exists, briefly explain why. (a) A function f : AC whose range is the set C. (b) A function g: BC whose range is the set C. (c) A function g: BC that is injective. (d) A function j : A → C that is not bijective.arrow_forwardLet f:R->R be defined by f(x)=x^(3)+5.(a) Determine if f is injective. why?(b) Determine if f is surjective. why?(c) Based upon (a) and (b), is f bijective? why?arrow_forward
- Let f:R->R be defined by f(x)=x^(3)+5.(a) Determine if f is injective.(b) Determine if f is surjective. (c) Based upon (a) and (b), is f bijective?arrow_forward1 S 0 sin(lnx) x² - 1 Inx dxarrow_forward2 6. Modelling. Suppose that we have two tanks (A and B) between which a mixture of brine flows. Tank A contains 200 liters of water in which 50 kilograms of salt has been dissolved and Tank B contains 100 liters of pure water. Water containing 1kg of salt per liter is pumped into Tank A at the rate of 5 liters per minute. Brine mixture is pumped into Tank A from Tank B at the rate of 3 liters per minute and brine mixture is pumped from Tank A into Tank B at the rate of 8 liters per minute. Brine is drained from Tank B at a rate of 5 liters per minute. (a) Draw and carefully label a picture of the situation, including both tanks and the flow of brine between them. JankA 1ks of Salt Slits Pump EL Brine mit tark A from tank 13 Tank 13 k 3L zooliters of Ico liters of water with pure water. Saky salt → 777 disslore inside Brine mix is pumped from tank A to B of 82 Brine drainen min by Gf salt (b) Assume all brine mixtures are well-stirred. If we let t be the time in minutes, let x(t) 1ks…arrow_forward
- No chatgpt plsarrow_forwardRemix 4. Direction Fields/Phase Portraits. Use the given direction fields to plot solution curves to each of the given initial value problems. (a) x = x+2y 1111 y = -3x+y with x(0) = 1, y(0) = -1 (b) Consider the initial value problem corresponding to the given phase portrait. x = y y' = 3x + 2y Draw two "straight line solutions" passing through (0,0) (c) Make guesses for the equations of the straight line solutions: y = ax.arrow_forwardIt was homeworkarrow_forward
 Algebra: Structure And Method, Book 1AlgebraISBN:9780395977224Author:Richard G. Brown, Mary P. Dolciani, Robert H. Sorgenfrey, William L. ColePublisher:McDougal Littell
 College Algebra (MindTap Course List)AlgebraISBN:9781305652231Author:R. David Gustafson, Jeff HughesPublisher:Cengage Learning
 Trigonometry (MindTap Course List)TrigonometryISBN:9781337278461Author:Ron LarsonPublisher:Cengage Learning
 College AlgebraAlgebraISBN:9781305115545Author:James Stewart, Lothar Redlin, Saleem WatsonPublisher:Cengage Learning
 Glencoe Algebra 1, Student Edition, 9780079039897...AlgebraISBN:9780079039897Author:CarterPublisher:McGraw Hill


