
Introductory Statistics
1st Edition
ISBN: 9781938168208
Author: Barbara Illowsky, Susan Dean
Publisher: OpenStax College
expand_more
expand_more
format_list_bulleted
Concept explainers
Videos
Textbook Question
Chapter 2, Problem 5P
For each of the following data sets, create a stem plot and identify any outliers.
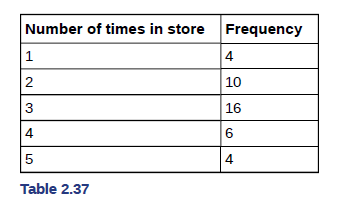
5. In a survey, 40 people were asked how many times they visited a store before making a major purchase. The results are shown in Table 2.37.
Expert Solution & Answer
Want to see the full answer?
Check out a sample textbook solution
Students have asked these similar questions
Techniques QUAT6221 2025 PT B...
TM
Tabudi Maphoru
Activities Assessments Class Progress lIE Library • Help v
The table below shows the prices (R) and quantities (kg) of rice, meat and potatoes items bought during 2013 and 2014:
2013
2014
P1Qo
PoQo
Q1Po P1Q1
Price
Ро
Quantity
Qo
Price
P1
Quantity
Q1
Rice
7
80
6
70
480
560
490
420
Meat
30
50
35
60
1 750
1 500
1 800
2 100
Potatoes
3
100
3
100
300
300
300
300
TOTAL
40
230
44
230
2 530
2 360
2 590
2 820
Instructions:
1 Corall dawn to tha bottom of thir ceraan urina se se tha haca nariad in archerca antarand cubmit
Q Search
ENG US
口X
2025/05
The table below indicates the number of years of experience of a sample of employees who work on a particular production line and the corresponding number of units of a good that each employee produced last month.
Years of Experience (x)
Number of Goods (y)
11
63
5
57
1
48
4
54
45
3
51
Q.1.1 By completing the table below and then applying the relevant formulae, determine the line of best fit for this bivariate data set.
Do NOT change the units for the variables.
X
y
X2
xy
Ex=
Ey=
EX2
EXY=
Q.1.2 Estimate the number of units of the good that would have been produced last month by an employee with 8 years of experience.
Q.1.3 Using your calculator, determine the coefficient of correlation for the data set.
Interpret your answer.
Q.1.4 Compute the coefficient of determination for the data set.
Interpret your answer.
Q.3.2 A sample of consumers was asked to name their favourite fruit. The results regarding the popularity of the different fruits are given in the following table.
Type of Fruit
Number of Consumers
Banana
25
Apple
20
Orange
5
TOTAL
50
Draw a bar chart to graphically illustrate the results given in the table.
Chapter 2 Solutions
Introductory Statistics
Ch. 2 - For the Park City basketball team, scores for the...Ch. 2 - The following data show the distances (in miles)...Ch. 2 - The table shows the number of sins and losses the...Ch. 2 - In a survey, 40 people were asked how many times...Ch. 2 - The population in Park City is made up of...Ch. 2 - Park city is broken down into six voting...Ch. 2 - The following data are the shoe sizes of 50 male...Ch. 2 - The following data are the number of sports played...Ch. 2 - The following data represent the number of...Ch. 2 - Construct a frequency polygon of U.S. Presidents’...
Ch. 2 - The following table is a portion of a data set...Ch. 2 - For the following 11 salaries, calculate the IQR...Ch. 2 - Find the interquartile range for the following two...Ch. 2 - Forty bus drivers were asked how many hours they...Ch. 2 - Refer to the Table 223. Find the third quartile....Ch. 2 - Listed are 29 ages for Academy Award sinning best...Ch. 2 - Listed are 30 ages for Academy Award winning best...Ch. 2 - For the 100-meter dash, the third quartile for...Ch. 2 - On a 60 point written assignment, the 80th...Ch. 2 - During a season, the 40th percentile for points...Ch. 2 - The following data are the number of pages In 40...Ch. 2 - The folloising data set show’s the heights in...Ch. 2 - Follow the steps you used to graph a...Ch. 2 - The following data show the number of months...Ch. 2 - In a sample of 60 households, one house is worth...Ch. 2 - The number of books checked out from the library...Ch. 2 - Five credit scores are 680, 680, 700, 720, 720....Ch. 2 - Mails conducted a study on the effect that playing...Ch. 2 - Discuss the mean, median, and mode for each of the...Ch. 2 - On a baseball team, the ages of each of the...Ch. 2 - The following data show the different types of pet...Ch. 2 - Find the standard deviation for the data from the...Ch. 2 - Two swimmers, Angie and Beth, from different...Ch. 2 - For each of the following data sets, create a stem...Ch. 2 - For each of the following data sets, create a stem...Ch. 2 - For each of the following data sets, create a stem...Ch. 2 - For each of the following data sets, create a stem...Ch. 2 - For each of the following data sets, create a stem...Ch. 2 - For each of the following data sets, create a stem...Ch. 2 - For each of the following data sets, create a stem...Ch. 2 - The students in Ms. Ramirez’s math class have...Ch. 2 - Using the data from Mrs. Ramirez’s math class...Ch. 2 - David County has six high schools. Each school...Ch. 2 - Use the data from the David County science...Ch. 2 - Sixty-five randomly selected car salespersons were...Ch. 2 - What does the frequency column in Table 2.42 sum...Ch. 2 - What does the relative frequency column in Table...Ch. 2 - What is the difference between relative frequency...Ch. 2 - What is the difference between cumulative relative...Ch. 2 - To construct the histogram for the data in Table...Ch. 2 -
Ch. 2 - Construct a frequency polygon from the frequency...Ch. 2 - Use the two frequency tables to compare the life...Ch. 2 - Construct a times series graph for (a) the number...Ch. 2 - The following data sets List full time police per...Ch. 2 - Listed are 29 ages for Academy Award winning best...Ch. 2 - Listed are 32 ages for Academy Award winning best...Ch. 2 - Jesse was ranked 37th in his graduating class of...Ch. 2 - a. For runners in a race, a low time means a...Ch. 2 - a. For runners in a race, a higher speed means a...Ch. 2 - On an exam, would it be more desirable to earn a...Ch. 2 - Mina is waiting in line at the Department of Motor...Ch. 2 - In a survey collecting data about the salaries...Ch. 2 - In a study collecting data about the repair costs...Ch. 2 - The University of California has two criteria used...Ch. 2 - Suppose that you are buying a house. You and your...Ch. 2 - First quartile = _______Ch. 2 - Second quartile = median = 50th percentile =Ch. 2 - Third quartile = _______Ch. 2 - Interquartile range (IQR) = _____ — _____Ch. 2 - Inteiquartile range (IQR = _____ — _____ = _____...Ch. 2 - percentile = _______Ch. 2 - Use the following information to answer the next...Ch. 2 - Use the following information to answer the next...Ch. 2 - Find the mean for the following frequency tables.Ch. 2 - Use the following information to answer the next...Ch. 2 - Use the following information to answer the next...Ch. 2 - Use the following information to answer the next...Ch. 2 - Use the following information to answer the next...Ch. 2 - Use the following information to answer the next...Ch. 2 - Use the following information to answer the next...Ch. 2 - Use the following information to answer the next...Ch. 2 - Use the following information to answer the next...Ch. 2 - Use the following information to answer the next...Ch. 2 - When the data are skewed left, what is the typical...Ch. 2 - When the data are symmetrical, what is the typical...Ch. 2 - What word describes a distribution that has two...Ch. 2 - Describe the shape of this distribution. Figure...Ch. 2 - Describe the relationship between the mode and the...Ch. 2 - Describe the relationship between the mean and the...Ch. 2 - Describe the shape of this distribution. Figure...Ch. 2 - Describe the relationship between the mode and the...Ch. 2 - Are the mean and the median the exact same in this...Ch. 2 - Describe the shape of this distribution. Figure...Ch. 2 - Describe the relationship between the mode and the...Ch. 2 - Describe the relationship between the mean and the...Ch. 2 - The mean and median for the data are the same. 3;...Ch. 2 - Which is the greatest, the mean, the mode, or the...Ch. 2 - Which is the least, the mean, the mode, and the...Ch. 2 - Of the three measures, which tends to reflect...Ch. 2 - In a perfectly symmetrical distribution, when...Ch. 2 - Use the following information to answer the next...Ch. 2 - Use the following information to answer the next...Ch. 2 - Two baseball players, Fredo and Karl, on different...Ch. 2 - Use Table 2.57 to find the value that is three...Ch. 2 - Find the standard deviation for the following...Ch. 2 - Student grades on a chemistry exam were: 77, 78,...Ch. 2 - Table 2.61 contains the 2010 obesity rates in U.S....Ch. 2 - Suppose that three book publishers were interested...Ch. 2 - Often, cruise ships conduct all on-board...Ch. 2 - Twenty-five randomly selected students were asked...Ch. 2 - The percentage of people who own at most three...Ch. 2 - If the data were collected by asking the first 111...Ch. 2 - Following are the 2010 obesity rates by U.S....Ch. 2 - The median age for U.S. blacks currently is 30.9...Ch. 2 - Six hundred adult Americans were asked by...Ch. 2 - Given the following box plot: Figure 2.41 a. which...Ch. 2 - The following box plot shows the U.S. population...Ch. 2 - In a survey of 2O-year-olds in China, Germany, and...Ch. 2 - Given the following box plot, answer the...Ch. 2 - Given the following box plots, answer t*...Ch. 2 - A survey was conducted of 130 purchases of new BMW...Ch. 2 - Twenty-five randomly selected students were asked...Ch. 2 - The most obese countries in the world have obesity...Ch. 2 - Table 2.72 gives the percent of children under...Ch. 2 - The median age of the U.S. population in 1980 was...Ch. 2 - Use the following information to answer the neat...Ch. 2 - Use the following information to answer the neat...Ch. 2 - Use the following information to answer the neat...Ch. 2 - Use the following information to answer the neat...Ch. 2 - Use the following information to answer the neat...Ch. 2 - Use the following information to answer the neat...Ch. 2 - Use the following information to answer the neat...Ch. 2 - Use the following information to answer the neat...Ch. 2 - Use the following information to answer the neat...Ch. 2 - Three students were applying to the same graduate...Ch. 2 - A music school has budgeted to purchase three...Ch. 2 - An elementary school class ran one mile with a...Ch. 2 - The most obese countries in the world have obesity...Ch. 2 - Table 2.76 gives the percent of children under...Ch. 2 - Santa, Clara Country, Ca, has approximately 27,873...Ch. 2 - Javier and Ercilia are supervisors at a shopping...Ch. 2 - What is the IQR? a. 8 b. 11 C. 15 d. 35Ch. 2 - What is the mode? a. 19 b. 19.5 c. 1and 20 d....Ch. 2 - Is this a sample or the entire population? a....Ch. 2 - Twenty-five randomly selected students were asked...Ch. 2 - Forty randomly selected students were asked the...Ch. 2 - Following are the published weights (in pounds) of...Ch. 2 - One hundred teachers attended a seminar on...Ch. 2 - Refer to Figure 2.50 determine which of the...Ch. 2 - In a recent issue of the IFFF Spectrum, 84...Ch. 2 - A survey of enrollment at 35 community colleges...Ch. 2 - Use the following information to answer the next...Ch. 2 - Use the following information to answer the not...Ch. 2 - Suppose that a publisher conducted a survey asking...
Additional Math Textbook Solutions
Find more solutions based on key concepts
A categorical variable has three categories, with the following frequencies of occurrence: a. Compute the perce...
Basic Business Statistics, Student Value Edition
TRY IT YOURSELF 1
Find the mean of the points scored by the 51 winning teams listed on page 39.
Elementary Statistics: Picturing the World (7th Edition)
Snow Depth (Example 3) Eric wants to go skiing tomorrow, but only if there are 3 inches or more of new snow. Ac...
Introductory Statistics
Identifying Probability Distributions. In Exercises 7–14, determine whether a probability distribution is given...
Elementary Statistics (13th Edition)
Sine substitution Evaluate the following integrals. 7. 05/2dx25x2
Calculus: Early Transcendentals (2nd Edition)
Knowledge Booster


Learn more about
Need a deep-dive on the concept behind this application? Look no further. Learn more about this topic, statistics and related others by exploring similar questions and additional content below.Similar questions
- Q.2.3 The probability that a randomly selected employee of Company Z is female is 0.75. The probability that an employee of the same company works in the Production department, given that the employee is female, is 0.25. What is the probability that a randomly selected employee of the company will be female and will work in the Production department? Q.2.4 There are twelve (12) teams participating in a pub quiz. What is the probability of correctly predicting the top three teams at the end of the competition, in the correct order? Give your final answer as a fraction in its simplest form.arrow_forwardQ.2.1 A bag contains 13 red and 9 green marbles. You are asked to select two (2) marbles from the bag. The first marble selected will not be placed back into the bag. Q.2.1.1 Construct a probability tree to indicate the various possible outcomes and their probabilities (as fractions). Q.2.1.2 What is the probability that the two selected marbles will be the same colour? Q.2.2 The following contingency table gives the results of a sample survey of South African male and female respondents with regard to their preferred brand of sports watch: PREFERRED BRAND OF SPORTS WATCH Samsung Apple Garmin TOTAL No. of Females 30 100 40 170 No. of Males 75 125 80 280 TOTAL 105 225 120 450 Q.2.2.1 What is the probability of randomly selecting a respondent from the sample who prefers Garmin? Q.2.2.2 What is the probability of randomly selecting a respondent from the sample who is not female? Q.2.2.3 What is the probability of randomly…arrow_forwardTest the claim that a student's pulse rate is different when taking a quiz than attending a regular class. The mean pulse rate difference is 2.7 with 10 students. Use a significance level of 0.005. Pulse rate difference(Quiz - Lecture) 2 -1 5 -8 1 20 15 -4 9 -12arrow_forward
- The following ordered data list shows the data speeds for cell phones used by a telephone company at an airport: A. Calculate the Measures of Central Tendency from the ungrouped data list. B. Group the data in an appropriate frequency table. C. Calculate the Measures of Central Tendency using the table in point B. D. Are there differences in the measurements obtained in A and C? Why (give at least one justified reason)? I leave the answers to A and B to resolve the remaining two. 0.8 1.4 1.8 1.9 3.2 3.6 4.5 4.5 4.6 6.2 6.5 7.7 7.9 9.9 10.2 10.3 10.9 11.1 11.1 11.6 11.8 12.0 13.1 13.5 13.7 14.1 14.2 14.7 15.0 15.1 15.5 15.8 16.0 17.5 18.2 20.2 21.1 21.5 22.2 22.4 23.1 24.5 25.7 28.5 34.6 38.5 43.0 55.6 71.3 77.8 A. Measures of Central Tendency We are to calculate: Mean, Median, Mode The data (already ordered) is: 0.8, 1.4, 1.8, 1.9, 3.2, 3.6, 4.5, 4.5, 4.6, 6.2, 6.5, 7.7, 7.9, 9.9, 10.2, 10.3, 10.9, 11.1, 11.1, 11.6, 11.8, 12.0, 13.1, 13.5, 13.7, 14.1, 14.2, 14.7, 15.0, 15.1, 15.5,…arrow_forwardPEER REPLY 1: Choose a classmate's Main Post. 1. Indicate a range of values for the independent variable (x) that is reasonable based on the data provided. 2. Explain what the predicted range of dependent values should be based on the range of independent values.arrow_forwardIn a company with 80 employees, 60 earn $10.00 per hour and 20 earn $13.00 per hour. Is this average hourly wage considered representative?arrow_forward
- The following is a list of questions answered correctly on an exam. Calculate the Measures of Central Tendency from the ungrouped data list. NUMBER OF QUESTIONS ANSWERED CORRECTLY ON AN APTITUDE EXAM 112 72 69 97 107 73 92 76 86 73 126 128 118 127 124 82 104 132 134 83 92 108 96 100 92 115 76 91 102 81 95 141 81 80 106 84 119 113 98 75 68 98 115 106 95 100 85 94 106 119arrow_forwardThe following ordered data list shows the data speeds for cell phones used by a telephone company at an airport: A. Calculate the Measures of Central Tendency using the table in point B. B. Are there differences in the measurements obtained in A and C? Why (give at least one justified reason)? 0.8 1.4 1.8 1.9 3.2 3.6 4.5 4.5 4.6 6.2 6.5 7.7 7.9 9.9 10.2 10.3 10.9 11.1 11.1 11.6 11.8 12.0 13.1 13.5 13.7 14.1 14.2 14.7 15.0 15.1 15.5 15.8 16.0 17.5 18.2 20.2 21.1 21.5 22.2 22.4 23.1 24.5 25.7 28.5 34.6 38.5 43.0 55.6 71.3 77.8arrow_forwardIn a company with 80 employees, 60 earn $10.00 per hour and 20 earn $13.00 per hour. a) Determine the average hourly wage. b) In part a), is the same answer obtained if the 60 employees have an average wage of $10.00 per hour? Prove your answer.arrow_forward
- The following ordered data list shows the data speeds for cell phones used by a telephone company at an airport: A. Calculate the Measures of Central Tendency from the ungrouped data list. B. Group the data in an appropriate frequency table. 0.8 1.4 1.8 1.9 3.2 3.6 4.5 4.5 4.6 6.2 6.5 7.7 7.9 9.9 10.2 10.3 10.9 11.1 11.1 11.6 11.8 12.0 13.1 13.5 13.7 14.1 14.2 14.7 15.0 15.1 15.5 15.8 16.0 17.5 18.2 20.2 21.1 21.5 22.2 22.4 23.1 24.5 25.7 28.5 34.6 38.5 43.0 55.6 71.3 77.8arrow_forwardBusinessarrow_forwardhttps://www.hawkeslearning.com/Statistics/dbs2/datasets.htmlarrow_forward
arrow_back_ios
SEE MORE QUESTIONS
arrow_forward_ios
Recommended textbooks for you
 Holt Mcdougal Larson Pre-algebra: Student Edition...AlgebraISBN:9780547587776Author:HOLT MCDOUGALPublisher:HOLT MCDOUGAL
 Big Ideas Math A Bridge To Success Algebra 1: Stu...AlgebraISBN:9781680331141Author:HOUGHTON MIFFLIN HARCOURTPublisher:Houghton Mifflin Harcourt
 Glencoe Algebra 1, Student Edition, 9780079039897...AlgebraISBN:9780079039897Author:CarterPublisher:McGraw Hill
 Functions and Change: A Modeling Approach to Coll...AlgebraISBN:9781337111348Author:Bruce Crauder, Benny Evans, Alan NoellPublisher:Cengage Learning
Holt Mcdougal Larson Pre-algebra: Student Edition...
Algebra
ISBN:9780547587776
Author:HOLT MCDOUGAL
Publisher:HOLT MCDOUGAL
Big Ideas Math A Bridge To Success Algebra 1: Stu...
Algebra
ISBN:9781680331141
Author:HOUGHTON MIFFLIN HARCOURT
Publisher:Houghton Mifflin Harcourt
Glencoe Algebra 1, Student Edition, 9780079039897...
Algebra
ISBN:9780079039897
Author:Carter
Publisher:McGraw Hill
Functions and Change: A Modeling Approach to Coll...
Algebra
ISBN:9781337111348
Author:Bruce Crauder, Benny Evans, Alan Noell
Publisher:Cengage Learning
Correlation Vs Regression: Difference Between them with definition & Comparison Chart; Author: Key Differences;https://www.youtube.com/watch?v=Ou2QGSJVd0U;License: Standard YouTube License, CC-BY
Correlation and Regression: Concepts with Illustrative examples; Author: LEARN & APPLY : Lean and Six Sigma;https://www.youtube.com/watch?v=xTpHD5WLuoA;License: Standard YouTube License, CC-BY