
Introductory Statistics
1st Edition
ISBN: 9781938168208
Author: Barbara Illowsky, Susan Dean
Publisher: OpenStax College
expand_more
expand_more
format_list_bulleted
Videos
Textbook Question
Chapter 2, Problem 58P
Describe the shape of this distribution.
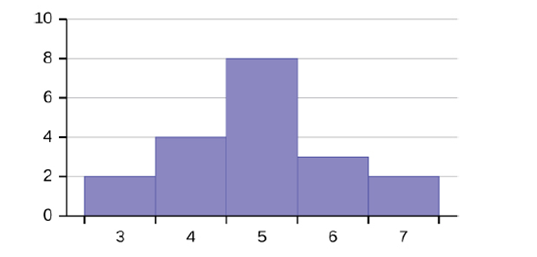
Figure 2.35
Expert Solution & Answer

Trending nowThis is a popular solution!

Students have asked these similar questions
A normal distribution has a mean of 50 and a standard deviation of 4. Solve the following three parts?
1. Compute the probability of a value between 44.0 and 55.0.
(The question requires finding probability value between 44 and 55. Solve it in 3 steps.
In the first step, use the above formula and x = 44, calculate probability value.
In the second step repeat the first step with the only difference that x=55.
In the third step, subtract the answer of the first part from the answer of the second part.)
2. Compute the probability of a value greater than 55.0.
Use the same formula, x=55 and subtract the answer from 1.
3. Compute the probability of a value between 52.0 and 55.0.
(The question requires finding probability value between 52 and 55. Solve it in 3 steps.
In the first step, use the above formula and x = 52, calculate probability value.
In the second step repeat the first step with the only difference that x=55.
In the third step, subtract the answer of the first part from the…
If a uniform distribution is defined over the interval from 6 to 10, then answer the followings:
What is the mean of this uniform distribution?
Show that the probability of any value between 6 and 10 is equal to 1.0
Find the probability of a value more than 7.
Find the probability of a value between 7 and 9.
The closing price of Schnur Sporting Goods Inc. common stock is uniformly distributed between $20 and $30 per share. What is the probability that the stock price will be:
More than $27?
Less than or equal to $24?
The April rainfall in Flagstaff, Arizona, follows a uniform distribution between 0.5 and 3.00 inches.
What is the mean amount of rainfall for the month?
What is the probability of less than an inch of rain for the month?
What is the probability of exactly 1.00 inch of rain?
What is the probability of more than 1.50 inches of rain for the month?
The best way to solve this problem is begin by a step by step creating a chart. Clearly mark the range, identifying the…
Client
1
Weight before
diet (pounds)
Weight after
diet (pounds)
128
120
2
131
123
3
140
141
4
178
170
5
121
118
6
136
136
7
118
121
8
136
127
Chapter 2 Solutions
Introductory Statistics
Ch. 2 - For the Park City basketball team, scores for the...Ch. 2 - The following data show the distances (in miles)...Ch. 2 - The table shows the number of sins and losses the...Ch. 2 - In a survey, 40 people were asked how many times...Ch. 2 - The population in Park City is made up of...Ch. 2 - Park city is broken down into six voting...Ch. 2 - The following data are the shoe sizes of 50 male...Ch. 2 - The following data are the number of sports played...Ch. 2 - The following data represent the number of...Ch. 2 - Construct a frequency polygon of U.S. Presidents’...
Ch. 2 - The following table is a portion of a data set...Ch. 2 - For the following 11 salaries, calculate the IQR...Ch. 2 - Find the interquartile range for the following two...Ch. 2 - Forty bus drivers were asked how many hours they...Ch. 2 - Refer to the Table 223. Find the third quartile....Ch. 2 - Listed are 29 ages for Academy Award sinning best...Ch. 2 - Listed are 30 ages for Academy Award winning best...Ch. 2 - For the 100-meter dash, the third quartile for...Ch. 2 - On a 60 point written assignment, the 80th...Ch. 2 - During a season, the 40th percentile for points...Ch. 2 - The following data are the number of pages In 40...Ch. 2 - The folloising data set show’s the heights in...Ch. 2 - Follow the steps you used to graph a...Ch. 2 - The following data show the number of months...Ch. 2 - In a sample of 60 households, one house is worth...Ch. 2 - The number of books checked out from the library...Ch. 2 - Five credit scores are 680, 680, 700, 720, 720....Ch. 2 - Mails conducted a study on the effect that playing...Ch. 2 - Discuss the mean, median, and mode for each of the...Ch. 2 - On a baseball team, the ages of each of the...Ch. 2 - The following data show the different types of pet...Ch. 2 - Find the standard deviation for the data from the...Ch. 2 - Two swimmers, Angie and Beth, from different...Ch. 2 - For each of the following data sets, create a stem...Ch. 2 - For each of the following data sets, create a stem...Ch. 2 - For each of the following data sets, create a stem...Ch. 2 - For each of the following data sets, create a stem...Ch. 2 - For each of the following data sets, create a stem...Ch. 2 - For each of the following data sets, create a stem...Ch. 2 - For each of the following data sets, create a stem...Ch. 2 - The students in Ms. Ramirez’s math class have...Ch. 2 - Using the data from Mrs. Ramirez’s math class...Ch. 2 - David County has six high schools. Each school...Ch. 2 - Use the data from the David County science...Ch. 2 - Sixty-five randomly selected car salespersons were...Ch. 2 - What does the frequency column in Table 2.42 sum...Ch. 2 - What does the relative frequency column in Table...Ch. 2 - What is the difference between relative frequency...Ch. 2 - What is the difference between cumulative relative...Ch. 2 - To construct the histogram for the data in Table...Ch. 2 -
Ch. 2 - Construct a frequency polygon from the frequency...Ch. 2 - Use the two frequency tables to compare the life...Ch. 2 - Construct a times series graph for (a) the number...Ch. 2 - The following data sets List full time police per...Ch. 2 - Listed are 29 ages for Academy Award winning best...Ch. 2 - Listed are 32 ages for Academy Award winning best...Ch. 2 - Jesse was ranked 37th in his graduating class of...Ch. 2 - a. For runners in a race, a low time means a...Ch. 2 - a. For runners in a race, a higher speed means a...Ch. 2 - On an exam, would it be more desirable to earn a...Ch. 2 - Mina is waiting in line at the Department of Motor...Ch. 2 - In a survey collecting data about the salaries...Ch. 2 - In a study collecting data about the repair costs...Ch. 2 - The University of California has two criteria used...Ch. 2 - Suppose that you are buying a house. You and your...Ch. 2 - First quartile = _______Ch. 2 - Second quartile = median = 50th percentile =Ch. 2 - Third quartile = _______Ch. 2 - Interquartile range (IQR) = _____ — _____Ch. 2 - Inteiquartile range (IQR = _____ — _____ = _____...Ch. 2 - percentile = _______Ch. 2 - Use the following information to answer the next...Ch. 2 - Use the following information to answer the next...Ch. 2 - Find the mean for the following frequency tables.Ch. 2 - Use the following information to answer the next...Ch. 2 - Use the following information to answer the next...Ch. 2 - Use the following information to answer the next...Ch. 2 - Use the following information to answer the next...Ch. 2 - Use the following information to answer the next...Ch. 2 - Use the following information to answer the next...Ch. 2 - Use the following information to answer the next...Ch. 2 - Use the following information to answer the next...Ch. 2 - Use the following information to answer the next...Ch. 2 - When the data are skewed left, what is the typical...Ch. 2 - When the data are symmetrical, what is the typical...Ch. 2 - What word describes a distribution that has two...Ch. 2 - Describe the shape of this distribution. Figure...Ch. 2 - Describe the relationship between the mode and the...Ch. 2 - Describe the relationship between the mean and the...Ch. 2 - Describe the shape of this distribution. Figure...Ch. 2 - Describe the relationship between the mode and the...Ch. 2 - Are the mean and the median the exact same in this...Ch. 2 - Describe the shape of this distribution. Figure...Ch. 2 - Describe the relationship between the mode and the...Ch. 2 - Describe the relationship between the mean and the...Ch. 2 - The mean and median for the data are the same. 3;...Ch. 2 - Which is the greatest, the mean, the mode, or the...Ch. 2 - Which is the least, the mean, the mode, and the...Ch. 2 - Of the three measures, which tends to reflect...Ch. 2 - In a perfectly symmetrical distribution, when...Ch. 2 - Use the following information to answer the next...Ch. 2 - Use the following information to answer the next...Ch. 2 - Two baseball players, Fredo and Karl, on different...Ch. 2 - Use Table 2.57 to find the value that is three...Ch. 2 - Find the standard deviation for the following...Ch. 2 - Student grades on a chemistry exam were: 77, 78,...Ch. 2 - Table 2.61 contains the 2010 obesity rates in U.S....Ch. 2 - Suppose that three book publishers were interested...Ch. 2 - Often, cruise ships conduct all on-board...Ch. 2 - Twenty-five randomly selected students were asked...Ch. 2 - The percentage of people who own at most three...Ch. 2 - If the data were collected by asking the first 111...Ch. 2 - Following are the 2010 obesity rates by U.S....Ch. 2 - The median age for U.S. blacks currently is 30.9...Ch. 2 - Six hundred adult Americans were asked by...Ch. 2 - Given the following box plot: Figure 2.41 a. which...Ch. 2 - The following box plot shows the U.S. population...Ch. 2 - In a survey of 2O-year-olds in China, Germany, and...Ch. 2 - Given the following box plot, answer the...Ch. 2 - Given the following box plots, answer t*...Ch. 2 - A survey was conducted of 130 purchases of new BMW...Ch. 2 - Twenty-five randomly selected students were asked...Ch. 2 - The most obese countries in the world have obesity...Ch. 2 - Table 2.72 gives the percent of children under...Ch. 2 - The median age of the U.S. population in 1980 was...Ch. 2 - Use the following information to answer the neat...Ch. 2 - Use the following information to answer the neat...Ch. 2 - Use the following information to answer the neat...Ch. 2 - Use the following information to answer the neat...Ch. 2 - Use the following information to answer the neat...Ch. 2 - Use the following information to answer the neat...Ch. 2 - Use the following information to answer the neat...Ch. 2 - Use the following information to answer the neat...Ch. 2 - Use the following information to answer the neat...Ch. 2 - Three students were applying to the same graduate...Ch. 2 - A music school has budgeted to purchase three...Ch. 2 - An elementary school class ran one mile with a...Ch. 2 - The most obese countries in the world have obesity...Ch. 2 - Table 2.76 gives the percent of children under...Ch. 2 - Santa, Clara Country, Ca, has approximately 27,873...Ch. 2 - Javier and Ercilia are supervisors at a shopping...Ch. 2 - What is the IQR? a. 8 b. 11 C. 15 d. 35Ch. 2 - What is the mode? a. 19 b. 19.5 c. 1and 20 d....Ch. 2 - Is this a sample or the entire population? a....Ch. 2 - Twenty-five randomly selected students were asked...Ch. 2 - Forty randomly selected students were asked the...Ch. 2 - Following are the published weights (in pounds) of...Ch. 2 - One hundred teachers attended a seminar on...Ch. 2 - Refer to Figure 2.50 determine which of the...Ch. 2 - In a recent issue of the IFFF Spectrum, 84...Ch. 2 - A survey of enrollment at 35 community colleges...Ch. 2 - Use the following information to answer the next...Ch. 2 - Use the following information to answer the not...Ch. 2 - Suppose that a publisher conducted a survey asking...
Additional Math Textbook Solutions
Find more solutions based on key concepts
CHECK POINT 1 Write a word description of the set L = {a, b, c, d, e, f}.
Thinking Mathematically (6th Edition)
Houses A real estate agent claims that all things being equal, houses with swimming pools tend to sell for less...
Introductory Statistics
Derivatives of Logarithms
In Exercises 11-40, find the derivative of y with respect to x, t, or θ, as appropria...
University Calculus: Early Transcendentals (4th Edition)
A child has 12 blocks, of which 6 are black, 4 are red, 1 is white, and 1 is blue. If the child puts the blocks...
A First Course in Probability (10th Edition)
Solve the inequality 3x27 .
Precalculus
Subtle substitutions Evaluate the following integrals. 17. 1e2ln2(x2)xdx
Calculus: Early Transcendentals (2nd Edition)
Knowledge Booster


Learn more about
Need a deep-dive on the concept behind this application? Look no further. Learn more about this topic, statistics and related others by exploring similar questions and additional content below.Similar questions
- Client 1 Weight before diet (pounds) Weight after diet (pounds) 128 120 2 131 123 3 140 141 4 178 170 5 121 118 6 136 136 7 118 121 8 136 127 a) Determine the mean change in patient weight from before to after the diet (after – before). What is the 95% confidence interval of this mean difference?arrow_forwardIn order to find probability, you can use this formula in Microsoft Excel: The best way to understand and solve these problems is by first drawing a bell curve and marking key points such as x, the mean, and the areas of interest. Once marked on the bell curve, figure out what calculations are needed to find the area of interest. =NORM.DIST(x, Mean, Standard Dev., TRUE). When the question mentions “greater than” you may have to subtract your answer from 1. When the question mentions “between (two values)”, you need to do separate calculation for both values and then subtract their results to get the answer. 1. Compute the probability of a value between 44.0 and 55.0. (The question requires finding probability value between 44 and 55. Solve it in 3 steps. In the first step, use the above formula and x = 44, calculate probability value. In the second step repeat the first step with the only difference that x=55. In the third step, subtract the answer of the first part from the…arrow_forwardIf a uniform distribution is defined over the interval from 6 to 10, then answer the followings: What is the mean of this uniform distribution? Show that the probability of any value between 6 and 10 is equal to 1.0 Find the probability of a value more than 7. Find the probability of a value between 7 and 9. The closing price of Schnur Sporting Goods Inc. common stock is uniformly distributed between $20 and $30 per share. What is the probability that the stock price will be: More than $27? Less than or equal to $24? The April rainfall in Flagstaff, Arizona, follows a uniform distribution between 0.5 and 3.00 inches. What is the mean amount of rainfall for the month? What is the probability of less than an inch of rain for the month? What is the probability of exactly 1.00 inch of rain? What is the probability of more than 1.50 inches of rain for the month? The best way to solve this problem is begin by creating a chart. Clearly mark the range, identifying the lower and upper…arrow_forward
- Problem 1: The mean hourly pay of an American Airlines flight attendant is normally distributed with a mean of 40 per hour and a standard deviation of 3.00 per hour. What is the probability that the hourly pay of a randomly selected flight attendant is: Between the mean and $45 per hour? More than $45 per hour? Less than $32 per hour? Problem 2: The mean of a normal probability distribution is 400 pounds. The standard deviation is 10 pounds. What is the area between 415 pounds and the mean of 400 pounds? What is the area between the mean and 395 pounds? What is the probability of randomly selecting a value less than 395 pounds? Problem 3: In New York State, the mean salary for high school teachers in 2022 was 81,410 with a standard deviation of 9,500. Only Alaska’s mean salary was higher. Assume New York’s state salaries follow a normal distribution. What percent of New York State high school teachers earn between 70,000 and 75,000? What percent of New York State high school…arrow_forwardPls help asaparrow_forwardSolve the following LP problem using the Extreme Point Theorem: Subject to: Maximize Z-6+4y 2+y≤8 2x + y ≤10 2,y20 Solve it using the graphical method. Guidelines for preparation for the teacher's questions: Understand the basics of Linear Programming (LP) 1. Know how to formulate an LP model. 2. Be able to identify decision variables, objective functions, and constraints. Be comfortable with graphical solutions 3. Know how to plot feasible regions and find extreme points. 4. Understand how constraints affect the solution space. Understand the Extreme Point Theorem 5. Know why solutions always occur at extreme points. 6. Be able to explain how optimization changes with different constraints. Think about real-world implications 7. Consider how removing or modifying constraints affects the solution. 8. Be prepared to explain why LP problems are used in business, economics, and operations research.arrow_forward
- ged the variance for group 1) Different groups of male stalk-eyed flies were raised on different diets: a high nutrient corn diet vs. a low nutrient cotton wool diet. Investigators wanted to see if diet quality influenced eye-stalk length. They obtained the following data: d Diet Sample Mean Eye-stalk Length Variance in Eye-stalk d size, n (mm) Length (mm²) Corn (group 1) 21 2.05 0.0558 Cotton (group 2) 24 1.54 0.0812 =205-1.54-05T a) Construct a 95% confidence interval for the difference in mean eye-stalk length between the two diets (e.g., use group 1 - group 2).arrow_forwardAn article in Business Week discussed the large spread between the federal funds rate and the average credit card rate. The table below is a frequency distribution of the credit card rate charged by the top 100 issuers. Credit Card Rates Credit Card Rate Frequency 18% -23% 19 17% -17.9% 16 16% -16.9% 31 15% -15.9% 26 14% -14.9% Copy Data 8 Step 1 of 2: Calculate the average credit card rate charged by the top 100 issuers based on the frequency distribution. Round your answer to two decimal places.arrow_forwardPlease could you check my answersarrow_forward
- Let Y₁, Y2,, Yy be random variables from an Exponential distribution with unknown mean 0. Let Ô be the maximum likelihood estimates for 0. The probability density function of y; is given by P(Yi; 0) = 0, yi≥ 0. The maximum likelihood estimate is given as follows: Select one: = n Σ19 1 Σ19 n-1 Σ19: n² Σ1arrow_forwardPlease could you help me answer parts d and e. Thanksarrow_forwardWhen fitting the model E[Y] = Bo+B1x1,i + B2x2; to a set of n = 25 observations, the following results were obtained using the general linear model notation: and 25 219 10232 551 XTX = 219 10232 3055 133899 133899 6725688, XTY 7361 337051 (XX)-- 0.1132 -0.0044 -0.00008 -0.0044 0.0027 -0.00004 -0.00008 -0.00004 0.00000129, Construct a multiple linear regression model Yin terms of the explanatory variables 1,i, x2,i- a) What is the value of the least squares estimate of the regression coefficient for 1,+? Give your answer correct to 3 decimal places. B1 b) Given that SSR = 5550, and SST=5784. Calculate the value of the MSg correct to 2 decimal places. c) What is the F statistics for this model correct to 2 decimal places?arrow_forward
arrow_back_ios
SEE MORE QUESTIONS
arrow_forward_ios
Recommended textbooks for you
 Glencoe Algebra 1, Student Edition, 9780079039897...AlgebraISBN:9780079039897Author:CarterPublisher:McGraw Hill
 Big Ideas Math A Bridge To Success Algebra 1: Stu...AlgebraISBN:9781680331141Author:HOUGHTON MIFFLIN HARCOURTPublisher:Houghton Mifflin Harcourt
 Algebra & Trigonometry with Analytic GeometryAlgebraISBN:9781133382119Author:SwokowskiPublisher:Cengage
 Holt Mcdougal Larson Pre-algebra: Student Edition...AlgebraISBN:9780547587776Author:HOLT MCDOUGALPublisher:HOLT MCDOUGAL
Glencoe Algebra 1, Student Edition, 9780079039897...
Algebra
ISBN:9780079039897
Author:Carter
Publisher:McGraw Hill
Big Ideas Math A Bridge To Success Algebra 1: Stu...
Algebra
ISBN:9781680331141
Author:HOUGHTON MIFFLIN HARCOURT
Publisher:Houghton Mifflin Harcourt
Algebra & Trigonometry with Analytic Geometry
Algebra
ISBN:9781133382119
Author:Swokowski
Publisher:Cengage
Holt Mcdougal Larson Pre-algebra: Student Edition...
Algebra
ISBN:9780547587776
Author:HOLT MCDOUGAL
Publisher:HOLT MCDOUGAL
How to make Frequency Distribution Table / Tally Marks and Frequency Distribution Table; Author: Reenu Math;https://www.youtube.com/watch?v=i_A6RiE8tLE;License: Standard YouTube License, CC-BY
Frequency distribution table in statistics; Author: Math and Science;https://www.youtube.com/watch?v=T7KYO76DoOE;License: Standard YouTube License, CC-BY
Frequency Distribution Table for Grouped/Continuous data | Math Dot Com; Author: Maths dotcom;https://www.youtube.com/watch?v=ErnccbXQOPY;License: Standard Youtube License