
Introductory Statistics
1st Edition
ISBN: 9781938168208
Author: Barbara Illowsky, Susan Dean
Publisher: OpenStax College
expand_more
expand_more
format_list_bulleted
Concept explainers
Videos
Textbook Question
Chapter 2, Problem 120BITH
Use the following information to answer the next two exercises. X = the number of days per week that 100 clients use a particular exercise facility.
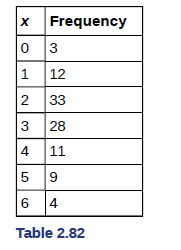
120. The 80th percentile is _____
a. 5
b. 80
c. 3
d. 4
Expert Solution & Answer
Want to see the full answer?
Check out a sample textbook solution
Students have asked these similar questions
NC Current Students - North Ce X | NC Canvas Login Links - North ( X
Final Exam Comprehensive x Cengage Learning
x
WASTAT - Final Exam - STAT
→
C
webassign.net/web/Student/Assignment-Responses/submit?dep=36055360&tags=autosave#question3659890_9
Part (b)
Draw a scatter plot of the ordered pairs.
N
Life
Expectancy
Life
Expectancy
80
70
600
50
40
30
20
10
Year of
1950
1970 1990
2010 Birth
O
Life
Expectancy
Part (c)
800
70
60
50
40
30
20
10
1950
1970 1990
W
ALT
林
$
#
4
R
J7
Year of
2010 Birth
F6
4+
80
70
60
50
40
30
20
10
Year of
1950 1970 1990
2010 Birth
Life
Expectancy
Ox
800
70
60
50
40
30
20
10
Year of
1950 1970 1990 2010 Birth
hp
P.B.
KA
&
7
80
% 5
H
A
B
F10
711
N
M
K
744
PRT SC
ALT
CTRL
Harvard University
California Institute of Technology
Massachusetts Institute of Technology
Stanford University
Princeton University
University of Cambridge
University of Oxford
University of California, Berkeley
Imperial College London
Yale University
University of California, Los Angeles
University of Chicago
Johns Hopkins University
Cornell University
ETH Zurich
University of Michigan
University of Toronto
Columbia University
University of Pennsylvania
Carnegie Mellon University
University of Hong Kong
University College London
University of Washington
Duke University
Northwestern University
University of Tokyo
Georgia Institute of Technology
Pohang University of Science and Technology
University of California, Santa Barbara
University of British Columbia
University of North Carolina at Chapel Hill
University of California, San Diego
University of Illinois at Urbana-Champaign
National University of Singapore
McGill…
Name
Harvard University
California Institute of Technology
Massachusetts Institute of Technology
Stanford University
Princeton University
University of Cambridge
University of Oxford
University of California, Berkeley
Imperial College London
Yale University
University of California, Los Angeles
University of Chicago
Johns Hopkins University
Cornell University
ETH Zurich
University of Michigan
University of Toronto
Columbia University
University of Pennsylvania
Carnegie Mellon University
University of Hong Kong
University College London
University of Washington
Duke University
Northwestern University
University of Tokyo
Georgia Institute of Technology
Pohang University of Science and Technology
University of California, Santa Barbara
University of British Columbia
University of North Carolina at Chapel Hill
University of California, San Diego
University of Illinois at Urbana-Champaign
National University of Singapore…
Chapter 2 Solutions
Introductory Statistics
Ch. 2 - For the Park City basketball team, scores for the...Ch. 2 - The following data show the distances (in miles)...Ch. 2 - The table shows the number of sins and losses the...Ch. 2 - In a survey, 40 people were asked how many times...Ch. 2 - The population in Park City is made up of...Ch. 2 - Park city is broken down into six voting...Ch. 2 - The following data are the shoe sizes of 50 male...Ch. 2 - The following data are the number of sports played...Ch. 2 - The following data represent the number of...Ch. 2 - Construct a frequency polygon of U.S. Presidents’...
Ch. 2 - The following table is a portion of a data set...Ch. 2 - For the following 11 salaries, calculate the IQR...Ch. 2 - Find the interquartile range for the following two...Ch. 2 - Forty bus drivers were asked how many hours they...Ch. 2 - Refer to the Table 223. Find the third quartile....Ch. 2 - Listed are 29 ages for Academy Award sinning best...Ch. 2 - Listed are 30 ages for Academy Award winning best...Ch. 2 - For the 100-meter dash, the third quartile for...Ch. 2 - On a 60 point written assignment, the 80th...Ch. 2 - During a season, the 40th percentile for points...Ch. 2 - The following data are the number of pages In 40...Ch. 2 - The folloising data set show’s the heights in...Ch. 2 - Follow the steps you used to graph a...Ch. 2 - The following data show the number of months...Ch. 2 - In a sample of 60 households, one house is worth...Ch. 2 - The number of books checked out from the library...Ch. 2 - Five credit scores are 680, 680, 700, 720, 720....Ch. 2 - Mails conducted a study on the effect that playing...Ch. 2 - Discuss the mean, median, and mode for each of the...Ch. 2 - On a baseball team, the ages of each of the...Ch. 2 - The following data show the different types of pet...Ch. 2 - Find the standard deviation for the data from the...Ch. 2 - Two swimmers, Angie and Beth, from different...Ch. 2 - For each of the following data sets, create a stem...Ch. 2 - For each of the following data sets, create a stem...Ch. 2 - For each of the following data sets, create a stem...Ch. 2 - For each of the following data sets, create a stem...Ch. 2 - For each of the following data sets, create a stem...Ch. 2 - For each of the following data sets, create a stem...Ch. 2 - For each of the following data sets, create a stem...Ch. 2 - The students in Ms. Ramirez’s math class have...Ch. 2 - Using the data from Mrs. Ramirez’s math class...Ch. 2 - David County has six high schools. Each school...Ch. 2 - Use the data from the David County science...Ch. 2 - Sixty-five randomly selected car salespersons were...Ch. 2 - What does the frequency column in Table 2.42 sum...Ch. 2 - What does the relative frequency column in Table...Ch. 2 - What is the difference between relative frequency...Ch. 2 - What is the difference between cumulative relative...Ch. 2 - To construct the histogram for the data in Table...Ch. 2 -
Ch. 2 - Construct a frequency polygon from the frequency...Ch. 2 - Use the two frequency tables to compare the life...Ch. 2 - Construct a times series graph for (a) the number...Ch. 2 - The following data sets List full time police per...Ch. 2 - Listed are 29 ages for Academy Award winning best...Ch. 2 - Listed are 32 ages for Academy Award winning best...Ch. 2 - Jesse was ranked 37th in his graduating class of...Ch. 2 - a. For runners in a race, a low time means a...Ch. 2 - a. For runners in a race, a higher speed means a...Ch. 2 - On an exam, would it be more desirable to earn a...Ch. 2 - Mina is waiting in line at the Department of Motor...Ch. 2 - In a survey collecting data about the salaries...Ch. 2 - In a study collecting data about the repair costs...Ch. 2 - The University of California has two criteria used...Ch. 2 - Suppose that you are buying a house. You and your...Ch. 2 - First quartile = _______Ch. 2 - Second quartile = median = 50th percentile =Ch. 2 - Third quartile = _______Ch. 2 - Interquartile range (IQR) = _____ — _____Ch. 2 - Inteiquartile range (IQR = _____ — _____ = _____...Ch. 2 - percentile = _______Ch. 2 - Use the following information to answer the next...Ch. 2 - Use the following information to answer the next...Ch. 2 - Find the mean for the following frequency tables.Ch. 2 - Use the following information to answer the next...Ch. 2 - Use the following information to answer the next...Ch. 2 - Use the following information to answer the next...Ch. 2 - Use the following information to answer the next...Ch. 2 - Use the following information to answer the next...Ch. 2 - Use the following information to answer the next...Ch. 2 - Use the following information to answer the next...Ch. 2 - Use the following information to answer the next...Ch. 2 - Use the following information to answer the next...Ch. 2 - When the data are skewed left, what is the typical...Ch. 2 - When the data are symmetrical, what is the typical...Ch. 2 - What word describes a distribution that has two...Ch. 2 - Describe the shape of this distribution. Figure...Ch. 2 - Describe the relationship between the mode and the...Ch. 2 - Describe the relationship between the mean and the...Ch. 2 - Describe the shape of this distribution. Figure...Ch. 2 - Describe the relationship between the mode and the...Ch. 2 - Are the mean and the median the exact same in this...Ch. 2 - Describe the shape of this distribution. Figure...Ch. 2 - Describe the relationship between the mode and the...Ch. 2 - Describe the relationship between the mean and the...Ch. 2 - The mean and median for the data are the same. 3;...Ch. 2 - Which is the greatest, the mean, the mode, or the...Ch. 2 - Which is the least, the mean, the mode, and the...Ch. 2 - Of the three measures, which tends to reflect...Ch. 2 - In a perfectly symmetrical distribution, when...Ch. 2 - Use the following information to answer the next...Ch. 2 - Use the following information to answer the next...Ch. 2 - Two baseball players, Fredo and Karl, on different...Ch. 2 - Use Table 2.57 to find the value that is three...Ch. 2 - Find the standard deviation for the following...Ch. 2 - Student grades on a chemistry exam were: 77, 78,...Ch. 2 - Table 2.61 contains the 2010 obesity rates in U.S....Ch. 2 - Suppose that three book publishers were interested...Ch. 2 - Often, cruise ships conduct all on-board...Ch. 2 - Twenty-five randomly selected students were asked...Ch. 2 - The percentage of people who own at most three...Ch. 2 - If the data were collected by asking the first 111...Ch. 2 - Following are the 2010 obesity rates by U.S....Ch. 2 - The median age for U.S. blacks currently is 30.9...Ch. 2 - Six hundred adult Americans were asked by...Ch. 2 - Given the following box plot: Figure 2.41 a. which...Ch. 2 - The following box plot shows the U.S. population...Ch. 2 - In a survey of 2O-year-olds in China, Germany, and...Ch. 2 - Given the following box plot, answer the...Ch. 2 - Given the following box plots, answer t*...Ch. 2 - A survey was conducted of 130 purchases of new BMW...Ch. 2 - Twenty-five randomly selected students were asked...Ch. 2 - The most obese countries in the world have obesity...Ch. 2 - Table 2.72 gives the percent of children under...Ch. 2 - The median age of the U.S. population in 1980 was...Ch. 2 - Use the following information to answer the neat...Ch. 2 - Use the following information to answer the neat...Ch. 2 - Use the following information to answer the neat...Ch. 2 - Use the following information to answer the neat...Ch. 2 - Use the following information to answer the neat...Ch. 2 - Use the following information to answer the neat...Ch. 2 - Use the following information to answer the neat...Ch. 2 - Use the following information to answer the neat...Ch. 2 - Use the following information to answer the neat...Ch. 2 - Three students were applying to the same graduate...Ch. 2 - A music school has budgeted to purchase three...Ch. 2 - An elementary school class ran one mile with a...Ch. 2 - The most obese countries in the world have obesity...Ch. 2 - Table 2.76 gives the percent of children under...Ch. 2 - Santa, Clara Country, Ca, has approximately 27,873...Ch. 2 - Javier and Ercilia are supervisors at a shopping...Ch. 2 - What is the IQR? a. 8 b. 11 C. 15 d. 35Ch. 2 - What is the mode? a. 19 b. 19.5 c. 1and 20 d....Ch. 2 - Is this a sample or the entire population? a....Ch. 2 - Twenty-five randomly selected students were asked...Ch. 2 - Forty randomly selected students were asked the...Ch. 2 - Following are the published weights (in pounds) of...Ch. 2 - One hundred teachers attended a seminar on...Ch. 2 - Refer to Figure 2.50 determine which of the...Ch. 2 - In a recent issue of the IFFF Spectrum, 84...Ch. 2 - A survey of enrollment at 35 community colleges...Ch. 2 - Use the following information to answer the next...Ch. 2 - Use the following information to answer the not...Ch. 2 - Suppose that a publisher conducted a survey asking...
Additional Math Textbook Solutions
Find more solutions based on key concepts
A categorical variable has three categories, with the following frequencies of occurrence: a. Compute the perce...
Basic Business Statistics, Student Value Edition
Trigonometric substitutions Evaluate the following integrals. 25. dxx281,x9
Calculus: Early Transcendentals (2nd Edition)
29-36. Total and Annual Returns. Compute the total and annual returns on the following investments.
29. Five ye...
Using and Understanding Mathematics: A Quantitative Reasoning Approach (6th Edition)
For what values of a is
continuous at every x?
University Calculus: Early Transcendentals (4th Edition)
A child has 12 blocks, of which 6 are black, 4 are red, 1 is white, and 1 is blue. If the child puts the blocks...
A First Course in Probability (10th Edition)
Conclusions. In Exercises 9–12, refer to the exercise identified. Make subjective estimates to decide whether r...
Elementary Statistics (13th Edition)
Knowledge Booster


Learn more about
Need a deep-dive on the concept behind this application? Look no further. Learn more about this topic, statistics and related others by exploring similar questions and additional content below.Similar questions
- A company found that the daily sales revenue of its flagship product follows a normal distribution with a mean of $4500 and a standard deviation of $450. The company defines a "high-sales day" that is, any day with sales exceeding $4800. please provide a step by step on how to get the answers in excel Q: What percentage of days can the company expect to have "high-sales days" or sales greater than $4800? Q: What is the sales revenue threshold for the bottom 10% of days? (please note that 10% refers to the probability/area under bell curve towards the lower tail of bell curve) Provide answers in the yellow cellsarrow_forwardFind the critical value for a left-tailed test using the F distribution with a 0.025, degrees of freedom in the numerator=12, and degrees of freedom in the denominator = 50. A portion of the table of critical values of the F-distribution is provided. Click the icon to view the partial table of critical values of the F-distribution. What is the critical value? (Round to two decimal places as needed.)arrow_forwardA retail store manager claims that the average daily sales of the store are $1,500. You aim to test whether the actual average daily sales differ significantly from this claimed value. You can provide your answer by inserting a text box and the answer must include: Null hypothesis, Alternative hypothesis, Show answer (output table/summary table), and Conclusion based on the P value. Showing the calculation is a must. If calculation is missing,so please provide a step by step on the answers Numerical answers in the yellow cellsarrow_forward
arrow_back_ios
SEE MORE QUESTIONS
arrow_forward_ios
Recommended textbooks for you
 Holt Mcdougal Larson Pre-algebra: Student Edition...AlgebraISBN:9780547587776Author:HOLT MCDOUGALPublisher:HOLT MCDOUGAL
 Glencoe Algebra 1, Student Edition, 9780079039897...AlgebraISBN:9780079039897Author:CarterPublisher:McGraw Hill
 Big Ideas Math A Bridge To Success Algebra 1: Stu...AlgebraISBN:9781680331141Author:HOUGHTON MIFFLIN HARCOURTPublisher:Houghton Mifflin Harcourt
 Algebra: Structure And Method, Book 1AlgebraISBN:9780395977224Author:Richard G. Brown, Mary P. Dolciani, Robert H. Sorgenfrey, William L. ColePublisher:McDougal Littell
 Functions and Change: A Modeling Approach to Coll...AlgebraISBN:9781337111348Author:Bruce Crauder, Benny Evans, Alan NoellPublisher:Cengage Learning
Holt Mcdougal Larson Pre-algebra: Student Edition...
Algebra
ISBN:9780547587776
Author:HOLT MCDOUGAL
Publisher:HOLT MCDOUGAL
Glencoe Algebra 1, Student Edition, 9780079039897...
Algebra
ISBN:9780079039897
Author:Carter
Publisher:McGraw Hill
Big Ideas Math A Bridge To Success Algebra 1: Stu...
Algebra
ISBN:9781680331141
Author:HOUGHTON MIFFLIN HARCOURT
Publisher:Houghton Mifflin Harcourt
Algebra: Structure And Method, Book 1
Algebra
ISBN:9780395977224
Author:Richard G. Brown, Mary P. Dolciani, Robert H. Sorgenfrey, William L. Cole
Publisher:McDougal Littell
Functions and Change: A Modeling Approach to Coll...
Algebra
ISBN:9781337111348
Author:Bruce Crauder, Benny Evans, Alan Noell
Publisher:Cengage Learning
The Shape of Data: Distributions: Crash Course Statistics #7; Author: CrashCourse;https://www.youtube.com/watch?v=bPFNxD3Yg6U;License: Standard YouTube License, CC-BY
Shape, Center, and Spread - Module 20.2 (Part 1); Author: Mrmathblog;https://www.youtube.com/watch?v=COaid7O_Gag;License: Standard YouTube License, CC-BY
Shape, Center and Spread; Author: Emily Murdock;https://www.youtube.com/watch?v=_YyW0DSCzpM;License: Standard Youtube License