Suppose that three book publishers were interested in the number of fiction paperbacks adult consumers purchase per month. Each publisher conducted a survey. In the survey, adult consumers were asked the number of fiction paperbacks they had purchased the previous month. The results are as follows: a. Find the relative frequencies for each survey. Write them in the charts b. Using either a graphing calculator, computer, or by hand, use the frequency column to construct a histogram for each publisher's survey. For Publishers A and B, make bar widths of one. For Publisher C, make bar widths of two. c. In complete sentences, give two reasons why the graphs for Publishers A and B are not identical. d. Would you have expected the graph for Publisher C to look like the other two graphs? Why or why not? e. Make new histograms for Publisher A and Publisher B. This time, make bar widths of two. f. Now, compare the graph for Publisher C to the new graphs for Publishers A and B. Are the graphs more similar or more different? Explain your answer.
Suppose that three book publishers were interested in the number of fiction paperbacks adult consumers purchase per month. Each publisher conducted a survey. In the survey, adult consumers were asked the number of fiction paperbacks they had purchased the previous month. The results are as follows: a. Find the relative frequencies for each survey. Write them in the charts b. Using either a graphing calculator, computer, or by hand, use the frequency column to construct a histogram for each publisher's survey. For Publishers A and B, make bar widths of one. For Publisher C, make bar widths of two. c. In complete sentences, give two reasons why the graphs for Publishers A and B are not identical. d. Would you have expected the graph for Publisher C to look like the other two graphs? Why or why not? e. Make new histograms for Publisher A and Publisher B. This time, make bar widths of two. f. Now, compare the graph for Publisher C to the new graphs for Publishers A and B. Are the graphs more similar or more different? Explain your answer.
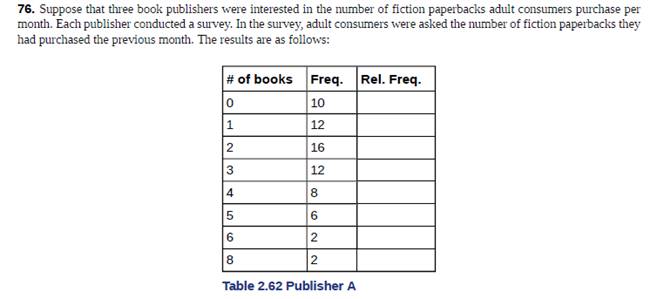
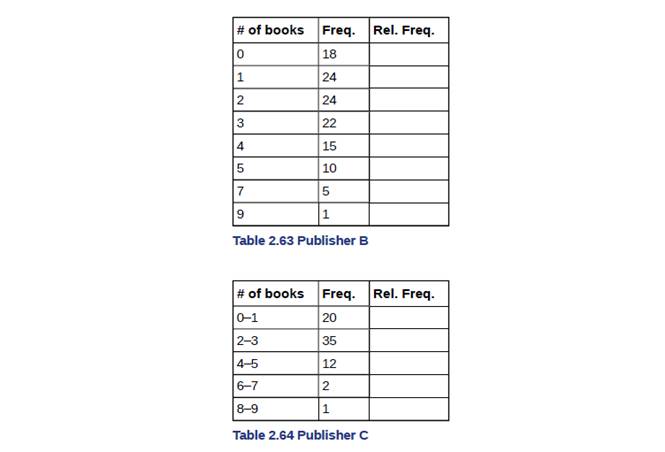
Suppose that three book publishers were interested in the number of fiction paperbacks adult consumers purchase per month. Each publisher conducted a survey. In the survey, adult consumers were asked the number of fiction paperbacks they had purchased the previous month. The results are as follows:
a. Find the relative frequencies for each survey. Write them in the charts
b. Using either a graphing calculator, computer, or by hand, use the frequency column to construct a histogram for each publisher's survey. For Publishers A and B, make bar widths of one. For Publisher C, make bar widths of two.
c. In complete sentences, give two reasons why the graphs for Publishers A and B are not identical.
d. Would you have expected the graph for Publisher C to look like the other two graphs? Why or why not?
e. Make new histograms for Publisher A and Publisher B. This time, make bar widths of two.
f. Now, compare the graph for Publisher C to the new graphs for Publishers A and B. Are the graphs more similar or more different? Explain your answer.
NC Current Students - North Ce X | NC Canvas Login Links - North ( X
Final Exam Comprehensive x Cengage Learning
x
WASTAT - Final Exam - STAT
→
C
webassign.net/web/Student/Assignment-Responses/submit?dep=36055360&tags=autosave#question3659890_9
Part (b)
Draw a scatter plot of the ordered pairs.
N
Life
Expectancy
Life
Expectancy
80
70
600
50
40
30
20
10
Year of
1950
1970 1990
2010 Birth
O
Life
Expectancy
Part (c)
800
70
60
50
40
30
20
10
1950
1970 1990
W
ALT
林
$
#
4
R
J7
Year of
2010 Birth
F6
4+
80
70
60
50
40
30
20
10
Year of
1950 1970 1990
2010 Birth
Life
Expectancy
Ox
800
70
60
50
40
30
20
10
Year of
1950 1970 1990 2010 Birth
hp
P.B.
KA
&
7
80
% 5
H
A
B
F10
711
N
M
K
744
PRT SC
ALT
CTRL
University Calculus: Early Transcendentals (4th Edition)
Knowledge Booster
Learn more about
Need a deep-dive on the concept behind this application? Look no further. Learn more about this topic, statistics and related others by exploring similar questions and additional content below.
How to make Frequency Distribution Table / Tally Marks and Frequency Distribution Table; Author: Reenu Math;https://www.youtube.com/watch?v=i_A6RiE8tLE;License: Standard YouTube License, CC-BY


 Holt Mcdougal Larson Pre-algebra: Student Edition...AlgebraISBN:9780547587776Author:HOLT MCDOUGALPublisher:HOLT MCDOUGAL
 Glencoe Algebra 1, Student Edition, 9780079039897...AlgebraISBN:9780079039897Author:CarterPublisher:McGraw Hill
 Big Ideas Math A Bridge To Success Algebra 1: Stu...AlgebraISBN:9781680331141Author:HOUGHTON MIFFLIN HARCOURTPublisher:Houghton Mifflin Harcourt
 Functions and Change: A Modeling Approach to Coll...AlgebraISBN:9781337111348Author:Bruce Crauder, Benny Evans, Alan NoellPublisher:Cengage Learning
 College Algebra (MindTap Course List)AlgebraISBN:9781305652231Author:R. David Gustafson, Jeff HughesPublisher:Cengage Learning