Often, cruise ships conduct all on-board transactions, with the exception of gambling, on a cashless basis. At the end of the cruise, guests pay one bill that covers all onboard transactions. Suppose that 60 single travelers and 70 couples were surveyed as to their on-board bills for a seven-day cruise from Los Angeles to the Mexican Riviera. Following is a summary of the bills for each group. a. Fill in the relative frequency for each group. b. Construct a histogram for the singles group. Scale the x-axis by $50 widths. Use relative frequency on the y-axis. c. Construct a histogram for the couples group. Scale the x-axis by $50 widths. Use relative frequency on they axis. d. Compare the two graphs: i. List two similarities between the graphs. ii. List two differences between the graphs. iii. Overall, are the graphs more similar or different? e. Construct a new graph for the couples by hand. Since each couple is paying for two individuals, instead of scaling the x-axis by $50, scale it by $100. Use relative frequency on the y axis. f. Compare the graph for the singles with the new graph for the couples: i. List two similarities between the graphs. ii. Overall, are the graphs more similar or different? g. How did scaling the couples graph differently change the way you compared it to the singles graph? h. Based on the graphs, do you think that individuals spend the same amount, more or less, as singles as they do person by person as a couple? Explain why in one or two complete sentences.
Often, cruise ships conduct all on-board transactions, with the exception of gambling, on a cashless basis. At the end of the cruise, guests pay one bill that covers all onboard transactions. Suppose that 60 single travelers and 70 couples were surveyed as to their on-board bills for a seven-day cruise from Los Angeles to the Mexican Riviera. Following is a summary of the bills for each group. a. Fill in the relative frequency for each group. b. Construct a histogram for the singles group. Scale the x-axis by $50 widths. Use relative frequency on the y-axis. c. Construct a histogram for the couples group. Scale the x-axis by $50 widths. Use relative frequency on they axis. d. Compare the two graphs: i. List two similarities between the graphs. ii. List two differences between the graphs. iii. Overall, are the graphs more similar or different? e. Construct a new graph for the couples by hand. Since each couple is paying for two individuals, instead of scaling the x-axis by $50, scale it by $100. Use relative frequency on the y axis. f. Compare the graph for the singles with the new graph for the couples: i. List two similarities between the graphs. ii. Overall, are the graphs more similar or different? g. How did scaling the couples graph differently change the way you compared it to the singles graph? h. Based on the graphs, do you think that individuals spend the same amount, more or less, as singles as they do person by person as a couple? Explain why in one or two complete sentences.
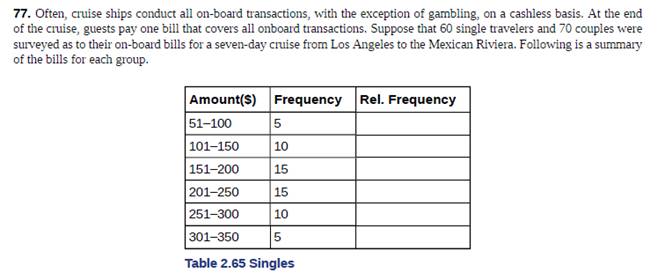
Often, cruise ships conduct all on-board transactions, with the exception of gambling, on a cashless basis. At the end of the cruise, guests pay one bill that covers all onboard transactions. Suppose that 60 single travelers and 70 couples were surveyed as to their on-board bills for a seven-day cruise from Los Angeles to the Mexican Riviera. Following is a summary of the bills for each group.
a. Fill in the relative frequency for each group.
b. Construct a histogram for the singles group. Scale the x-axis by $50 widths. Use relative frequency on the y-axis.
c. Construct a histogram for the couples group. Scale the x-axis by $50 widths. Use relative frequency on they axis.
d. Compare the two graphs:
i. List two similarities between the graphs.
ii. List two differences between the graphs.
iii. Overall, are the graphs more similar or different?
e. Construct a new graph for the couples by hand. Since each couple is paying for two individuals, instead of scaling the x-axis by $50, scale it by $100. Use relative frequency on the y axis.
f. Compare the graph for the singles with the new graph for the couples:
i. List two similarities between the graphs.
ii. Overall, are the graphs more similar or different?
g. How did scaling the couples graph differently change the way you compared it to the singles graph?
h. Based on the graphs, do you think that individuals spend the same amount, more or less, as singles as they do person by person as a couple? Explain why in one or two complete sentences.
3. Bayesian Inference – Updating Beliefs
A medical test for a rare disease has the following characteristics:
Sensitivity (true positive rate): 99%
Specificity (true negative rate): 98%
The disease occurs in 0.5% of the population.
A patient receives a positive test result.
Questions:
a) Define the relevant events and use Bayes’ Theorem to compute the probability that the patient actually has the disease.b) Explain why the result might seem counterintuitive, despite the high sensitivity and specificity.c) Discuss how prior probabilities influence posterior beliefs in Bayesian inference.d) Suppose a second, independent test with the same accuracy is conducted and is also positive. Update the probability that the patient has the disease.
4. Linear Regression - Model Assumptions and Interpretation
A real estate analyst is studying how house prices (Y) are related to house size in square feet (X). A simple
linear regression model is proposed:
The analyst fits the model and obtains:
•
Ŷ50,000+150X
YBoB₁X + €
•
R² = 0.76
• Residuals show a fan-shaped pattern when plotted against fitted values.
Questions:
a) Interpret the slope coefficient in context.
b) Explain what the R² value tells us about the model's performance.
c) Based on the residual pattern, what regression assumption is likely violated? What might be the
consequence?
d) Suggest at least two remedies to improve the model, based on the residual analysis.
Need a deep-dive on the concept behind this application? Look no further. Learn more about this topic, statistics and related others by exploring similar questions and additional content below.
How to make Frequency Distribution Table / Tally Marks and Frequency Distribution Table; Author: Reenu Math;https://www.youtube.com/watch?v=i_A6RiE8tLE;License: Standard YouTube License, CC-BY

 a. Fill in the relative frequency for each group.


 Glencoe Algebra 1, Student Edition, 9780079039897...AlgebraISBN:9780079039897Author:CarterPublisher:McGraw Hill
 Holt Mcdougal Larson Pre-algebra: Student Edition...AlgebraISBN:9780547587776Author:HOLT MCDOUGALPublisher:HOLT MCDOUGAL
 Big Ideas Math A Bridge To Success Algebra 1: Stu...AlgebraISBN:9781680331141Author:HOUGHTON MIFFLIN HARCOURTPublisher:Houghton Mifflin Harcourt