
Introductory Statistics
1st Edition
ISBN: 9781938168208
Author: Barbara Illowsky, Susan Dean
Publisher: OpenStax College
expand_more
expand_more
format_list_bulleted
Videos
Textbook Question
Chapter 2, Problem 14P
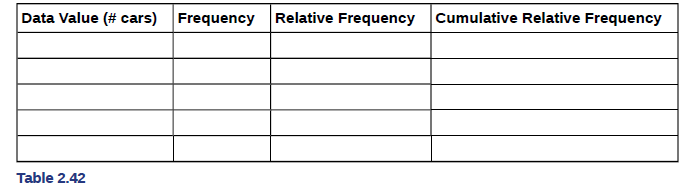
What does the relative frequency column in Table 2.42 sum to? Why?
Expert Solution & Answer

Trending nowThis is a popular solution!

Students have asked these similar questions
You have been hired as an intern to run analyses on the data and report the results back to Sarah; the five questions that Sarah needs you to address are given below.
Does there appear to be a positive or negative relationship between price and screen size? Use a scatter plot to examine the relationship.
Determine and interpret the correlation coefficient between the two variables. In your interpretation, discuss the direction of the relationship (positive, negative, or zero relationship). Also discuss the strength of the relationship.
Estimate the relationship between screen size and price using a simple linear regression model and interpret the estimated coefficients. (In your interpretation, tell the dollar amount by which price will change for each unit of increase in screen size).
Include the manufacturer dummy variable (Samsung=1, 0 otherwise) and estimate the relationship between screen size, price and manufacturer dummy as a multiple linear regression model.
Interpret the…
Does there appear to be a positive or negative relationship between price and screen size? Use a scatter plot to examine the relationship. How to take snapshots: if you use a MacBook, press Command+ Shift+4 to take snapshots. If you are using Windows, use the Snipping Tool to take snapshots.
Question 1: Determine and interpret the correlation coefficient between the two variables. In your interpretation, discuss the direction of the relationship (positive, negative, or zero relationship). Also discuss the strength of the relationship.
Value of correlation coefficient:
Direction of the relationship (positive, negative, or zero relationship):
Strength of the relationship (strong/moderate/weak):
Question 2: Estimate the relationship between screen size and price using a simple linear regression model and interpret the estimated coefficients. In your interpretation, tell the dollar amount by which price will change for each unit of increase in screen size. (The answer for the…
In this problem, we consider a Brownian motion (W+) t≥0. We consider a stock model (St)t>0
given (under the measure P) by
d.St 0.03 St dt + 0.2 St dwt,
with So 2. We assume that the interest rate is r = 0.06. The purpose of this problem is to
price an option on this stock (which we name cubic put). This option is European-type, with
maturity 3 months (i.e. T = 0.25 years), and payoff given by
F = (8-5)+
(a) Write the Stochastic Differential Equation satisfied by (St) under the risk-neutral measure
Q. (You don't need to prove it, simply give the answer.)
(b) Give the price of a regular European put on (St) with maturity 3 months and strike K = 2.
(c) Let X =
S. Find the Stochastic Differential Equation satisfied by the process (Xt)
under the measure Q.
(d) Find an explicit expression for X₁ = S3 under measure Q.
(e) Using the results above, find the price of the cubic put option mentioned above.
(f) Is the price in (e) the same as in question (b)? (Explain why.)
Chapter 2 Solutions
Introductory Statistics
Ch. 2 - For the Park City basketball team, scores for the...Ch. 2 - The following data show the distances (in miles)...Ch. 2 - The table shows the number of sins and losses the...Ch. 2 - In a survey, 40 people were asked how many times...Ch. 2 - The population in Park City is made up of...Ch. 2 - Park city is broken down into six voting...Ch. 2 - The following data are the shoe sizes of 50 male...Ch. 2 - The following data are the number of sports played...Ch. 2 - The following data represent the number of...Ch. 2 - Construct a frequency polygon of U.S. Presidents’...
Ch. 2 - The following table is a portion of a data set...Ch. 2 - For the following 11 salaries, calculate the IQR...Ch. 2 - Find the interquartile range for the following two...Ch. 2 - Forty bus drivers were asked how many hours they...Ch. 2 - Refer to the Table 223. Find the third quartile....Ch. 2 - Listed are 29 ages for Academy Award sinning best...Ch. 2 - Listed are 30 ages for Academy Award winning best...Ch. 2 - For the 100-meter dash, the third quartile for...Ch. 2 - On a 60 point written assignment, the 80th...Ch. 2 - During a season, the 40th percentile for points...Ch. 2 - The following data are the number of pages In 40...Ch. 2 - The folloising data set show’s the heights in...Ch. 2 - Follow the steps you used to graph a...Ch. 2 - The following data show the number of months...Ch. 2 - In a sample of 60 households, one house is worth...Ch. 2 - The number of books checked out from the library...Ch. 2 - Five credit scores are 680, 680, 700, 720, 720....Ch. 2 - Mails conducted a study on the effect that playing...Ch. 2 - Discuss the mean, median, and mode for each of the...Ch. 2 - On a baseball team, the ages of each of the...Ch. 2 - The following data show the different types of pet...Ch. 2 - Find the standard deviation for the data from the...Ch. 2 - Two swimmers, Angie and Beth, from different...Ch. 2 - For each of the following data sets, create a stem...Ch. 2 - For each of the following data sets, create a stem...Ch. 2 - For each of the following data sets, create a stem...Ch. 2 - For each of the following data sets, create a stem...Ch. 2 - For each of the following data sets, create a stem...Ch. 2 - For each of the following data sets, create a stem...Ch. 2 - For each of the following data sets, create a stem...Ch. 2 - The students in Ms. Ramirez’s math class have...Ch. 2 - Using the data from Mrs. Ramirez’s math class...Ch. 2 - David County has six high schools. Each school...Ch. 2 - Use the data from the David County science...Ch. 2 - Sixty-five randomly selected car salespersons were...Ch. 2 - What does the frequency column in Table 2.42 sum...Ch. 2 - What does the relative frequency column in Table...Ch. 2 - What is the difference between relative frequency...Ch. 2 - What is the difference between cumulative relative...Ch. 2 - To construct the histogram for the data in Table...Ch. 2 -
Ch. 2 - Construct a frequency polygon from the frequency...Ch. 2 - Use the two frequency tables to compare the life...Ch. 2 - Construct a times series graph for (a) the number...Ch. 2 - The following data sets List full time police per...Ch. 2 - Listed are 29 ages for Academy Award winning best...Ch. 2 - Listed are 32 ages for Academy Award winning best...Ch. 2 - Jesse was ranked 37th in his graduating class of...Ch. 2 - a. For runners in a race, a low time means a...Ch. 2 - a. For runners in a race, a higher speed means a...Ch. 2 - On an exam, would it be more desirable to earn a...Ch. 2 - Mina is waiting in line at the Department of Motor...Ch. 2 - In a survey collecting data about the salaries...Ch. 2 - In a study collecting data about the repair costs...Ch. 2 - The University of California has two criteria used...Ch. 2 - Suppose that you are buying a house. You and your...Ch. 2 - First quartile = _______Ch. 2 - Second quartile = median = 50th percentile =Ch. 2 - Third quartile = _______Ch. 2 - Interquartile range (IQR) = _____ — _____Ch. 2 - Inteiquartile range (IQR = _____ — _____ = _____...Ch. 2 - percentile = _______Ch. 2 - Use the following information to answer the next...Ch. 2 - Use the following information to answer the next...Ch. 2 - Find the mean for the following frequency tables.Ch. 2 - Use the following information to answer the next...Ch. 2 - Use the following information to answer the next...Ch. 2 - Use the following information to answer the next...Ch. 2 - Use the following information to answer the next...Ch. 2 - Use the following information to answer the next...Ch. 2 - Use the following information to answer the next...Ch. 2 - Use the following information to answer the next...Ch. 2 - Use the following information to answer the next...Ch. 2 - Use the following information to answer the next...Ch. 2 - When the data are skewed left, what is the typical...Ch. 2 - When the data are symmetrical, what is the typical...Ch. 2 - What word describes a distribution that has two...Ch. 2 - Describe the shape of this distribution. Figure...Ch. 2 - Describe the relationship between the mode and the...Ch. 2 - Describe the relationship between the mean and the...Ch. 2 - Describe the shape of this distribution. Figure...Ch. 2 - Describe the relationship between the mode and the...Ch. 2 - Are the mean and the median the exact same in this...Ch. 2 - Describe the shape of this distribution. Figure...Ch. 2 - Describe the relationship between the mode and the...Ch. 2 - Describe the relationship between the mean and the...Ch. 2 - The mean and median for the data are the same. 3;...Ch. 2 - Which is the greatest, the mean, the mode, or the...Ch. 2 - Which is the least, the mean, the mode, and the...Ch. 2 - Of the three measures, which tends to reflect...Ch. 2 - In a perfectly symmetrical distribution, when...Ch. 2 - Use the following information to answer the next...Ch. 2 - Use the following information to answer the next...Ch. 2 - Two baseball players, Fredo and Karl, on different...Ch. 2 - Use Table 2.57 to find the value that is three...Ch. 2 - Find the standard deviation for the following...Ch. 2 - Student grades on a chemistry exam were: 77, 78,...Ch. 2 - Table 2.61 contains the 2010 obesity rates in U.S....Ch. 2 - Suppose that three book publishers were interested...Ch. 2 - Often, cruise ships conduct all on-board...Ch. 2 - Twenty-five randomly selected students were asked...Ch. 2 - The percentage of people who own at most three...Ch. 2 - If the data were collected by asking the first 111...Ch. 2 - Following are the 2010 obesity rates by U.S....Ch. 2 - The median age for U.S. blacks currently is 30.9...Ch. 2 - Six hundred adult Americans were asked by...Ch. 2 - Given the following box plot: Figure 2.41 a. which...Ch. 2 - The following box plot shows the U.S. population...Ch. 2 - In a survey of 2O-year-olds in China, Germany, and...Ch. 2 - Given the following box plot, answer the...Ch. 2 - Given the following box plots, answer t*...Ch. 2 - A survey was conducted of 130 purchases of new BMW...Ch. 2 - Twenty-five randomly selected students were asked...Ch. 2 - The most obese countries in the world have obesity...Ch. 2 - Table 2.72 gives the percent of children under...Ch. 2 - The median age of the U.S. population in 1980 was...Ch. 2 - Use the following information to answer the neat...Ch. 2 - Use the following information to answer the neat...Ch. 2 - Use the following information to answer the neat...Ch. 2 - Use the following information to answer the neat...Ch. 2 - Use the following information to answer the neat...Ch. 2 - Use the following information to answer the neat...Ch. 2 - Use the following information to answer the neat...Ch. 2 - Use the following information to answer the neat...Ch. 2 - Use the following information to answer the neat...Ch. 2 - Three students were applying to the same graduate...Ch. 2 - A music school has budgeted to purchase three...Ch. 2 - An elementary school class ran one mile with a...Ch. 2 - The most obese countries in the world have obesity...Ch. 2 - Table 2.76 gives the percent of children under...Ch. 2 - Santa, Clara Country, Ca, has approximately 27,873...Ch. 2 - Javier and Ercilia are supervisors at a shopping...Ch. 2 - What is the IQR? a. 8 b. 11 C. 15 d. 35Ch. 2 - What is the mode? a. 19 b. 19.5 c. 1and 20 d....Ch. 2 - Is this a sample or the entire population? a....Ch. 2 - Twenty-five randomly selected students were asked...Ch. 2 - Forty randomly selected students were asked the...Ch. 2 - Following are the published weights (in pounds) of...Ch. 2 - One hundred teachers attended a seminar on...Ch. 2 - Refer to Figure 2.50 determine which of the...Ch. 2 - In a recent issue of the IFFF Spectrum, 84...Ch. 2 - A survey of enrollment at 35 community colleges...Ch. 2 - Use the following information to answer the next...Ch. 2 - Use the following information to answer the not...Ch. 2 - Suppose that a publisher conducted a survey asking...
Additional Math Textbook Solutions
Find more solutions based on key concepts
A student has to sell 2 books from a collection of 6 math, 7 science, and 4 economics books. How many choices a...
A First Course in Probability (10th Edition)
In Exercises 39–44, find a formula for the nth partial sum of the series and use it to determine whether the se...
University Calculus: Early Transcendentals (4th Edition)
Women’s Heights Suppose college women’s heights are approximately Normally distributed with a mean of 65 inches...
Introductory Statistics
TRY IT YOURSELF 1
Find the mean of the points scored by the 51 winning teams listed on page 39.
Elementary Statistics: Picturing the World (7th Edition)
Ladder against the wall A 13-foot ladder is leaning against a vertical wall (see figure) when Jack begins pulli...
Calculus: Early Transcendentals (2nd Edition)
Knowledge Booster


Learn more about
Need a deep-dive on the concept behind this application? Look no further. Learn more about this topic, statistics and related others by exploring similar questions and additional content below.Similar questions
- Problem 4. Margrabe formula and the Greeks (20 pts) In the homework, we determined the Margrabe formula for the price of an option allowing you to swap an x-stock for a y-stock at time T. For stocks with initial values xo, yo, common volatility σ and correlation p, the formula was given by Fo=yo (d+)-x0Þ(d_), where In (±² Ꭲ d+ õ√T and σ = σ√√√2(1 - p). дго (a) We want to determine a "Greek" for ỡ on the option: find a formula for θα (b) Is дго θα positive or negative? (c) We consider a situation in which the correlation p between the two stocks increases: what can you say about the price Fo? (d) Assume that yo< xo and p = 1. What is the price of the option?arrow_forwardWe consider a 4-dimensional stock price model given (under P) by dẴ₁ = µ· Xt dt + йt · ΣdŴt where (W) is an n-dimensional Brownian motion, π = (0.02, 0.01, -0.02, 0.05), 0.2 0 0 0 0.3 0.4 0 0 Σ= -0.1 -4a За 0 0.2 0.4 -0.1 0.2) and a E R. We assume that ☑0 = (1, 1, 1, 1) and that the interest rate on the market is r = 0.02. (a) Give a condition on a that would make stock #3 be the one with largest volatility. (b) Find the diversification coefficient for this portfolio as a function of a. (c) Determine the maximum diversification coefficient d that you could reach by varying the value of a? 2arrow_forwardQuestion 1. Your manager asks you to explain why the Black-Scholes model may be inappro- priate for pricing options in practice. Give one reason that would substantiate this claim? Question 2. We consider stock #1 and stock #2 in the model of Problem 2. Your manager asks you to pick only one of them to invest in based on the model provided. Which one do you choose and why ? Question 3. Let (St) to be an asset modeled by the Black-Scholes SDE. Let Ft be the price at time t of a European put with maturity T and strike price K. Then, the discounted option price process (ert Ft) t20 is a martingale. True or False? (Explain your answer.) Question 4. You are considering pricing an American put option using a Black-Scholes model for the underlying stock. An explicit formula for the price doesn't exist. In just a few words (no more than 2 sentences), explain how you would proceed to price it. Question 5. We model a short rate with a Ho-Lee model drt = ln(1+t) dt +2dWt. Then the interest rate…arrow_forward
- In this problem, we consider a Brownian motion (W+) t≥0. We consider a stock model (St)t>0 given (under the measure P) by d.St 0.03 St dt + 0.2 St dwt, with So 2. We assume that the interest rate is r = 0.06. The purpose of this problem is to price an option on this stock (which we name cubic put). This option is European-type, with maturity 3 months (i.e. T = 0.25 years), and payoff given by F = (8-5)+ (a) Write the Stochastic Differential Equation satisfied by (St) under the risk-neutral measure Q. (You don't need to prove it, simply give the answer.) (b) Give the price of a regular European put on (St) with maturity 3 months and strike K = 2. (c) Let X = S. Find the Stochastic Differential Equation satisfied by the process (Xt) under the measure Q. (d) Find an explicit expression for X₁ = S3 under measure Q. (e) Using the results above, find the price of the cubic put option mentioned above. (f) Is the price in (e) the same as in question (b)? (Explain why.)arrow_forwardThe managing director of a consulting group has the accompanying monthly data on total overhead costs and professional labor hours to bill to clients. Complete parts a through c. Question content area bottom Part 1 a. Develop a simple linear regression model between billable hours and overhead costs. Overhead Costsequals=212495.2212495.2plus+left parenthesis 42.4857 right parenthesis42.485742.4857times×Billable Hours (Round the constant to one decimal place as needed. Round the coefficient to four decimal places as needed. Do not include the $ symbol in your answers.) Part 2 b. Interpret the coefficients of your regression model. Specifically, what does the fixed component of the model mean to the consulting firm? Interpret the fixed term, b 0b0, if appropriate. Choose the correct answer below. A. The value of b 0b0 is the predicted billable hours for an overhead cost of 0 dollars. B. It is not appropriate to interpret b 0b0, because its value…arrow_forwardUsing the accompanying Home Market Value data and associated regression line, Market ValueMarket Valueequals=$28,416+$37.066×Square Feet, compute the errors associated with each observation using the formula e Subscript ieiequals=Upper Y Subscript iYiminus−ModifyingAbove Upper Y with caret Subscript iYi and construct a frequency distribution and histogram. LOADING... Click the icon to view the Home Market Value data. Question content area bottom Part 1 Construct a frequency distribution of the errors, e Subscript iei. (Type whole numbers.) Error Frequency minus−15 comma 00015,000less than< e Subscript iei less than or equals≤minus−10 comma 00010,000 0 minus−10 comma 00010,000less than< e Subscript iei less than or equals≤minus−50005000 5 minus−50005000less than< e Subscript iei less than or equals≤0 21 0less than< e Subscript iei less than or equals≤50005000 9…arrow_forward
- The managing director of a consulting group has the accompanying monthly data on total overhead costs and professional labor hours to bill to clients. Complete parts a through c Overhead Costs Billable Hours345000 3000385000 4000410000 5000462000 6000530000 7000545000 8000arrow_forwardUsing the accompanying Home Market Value data and associated regression line, Market ValueMarket Valueequals=$28,416plus+$37.066×Square Feet, compute the errors associated with each observation using the formula e Subscript ieiequals=Upper Y Subscript iYiminus−ModifyingAbove Upper Y with caret Subscript iYi and construct a frequency distribution and histogram. Square Feet Market Value1813 911001916 1043001842 934001814 909001836 1020002030 1085001731 877001852 960001793 893001665 884001852 1009001619 967001690 876002370 1139002373 1131001666 875002122 1161001619 946001729 863001667 871001522 833001484 798001589 814001600 871001484 825001483 787001522 877001703 942001485 820001468 881001519 882001518 885001483 765001522 844001668 909001587 810001782 912001483 812001519 1007001522 872001684 966001581 86200arrow_forwarda. Find the value of A.b. Find pX(x) and py(y).c. Find pX|y(x|y) and py|X(y|x)d. Are x and y independent? Why or why not?arrow_forward
- The PDF of an amplitude X of a Gaussian signal x(t) is given by:arrow_forwardThe PDF of a random variable X is given by the equation in the picture.arrow_forwardFor a binary asymmetric channel with Py|X(0|1) = 0.1 and Py|X(1|0) = 0.2; PX(0) = 0.4 isthe probability of a bit of “0” being transmitted. X is the transmitted digit, and Y is the received digit.a. Find the values of Py(0) and Py(1).b. What is the probability that only 0s will be received for a sequence of 10 digits transmitted?c. What is the probability that 8 1s and 2 0s will be received for the same sequence of 10 digits?d. What is the probability that at least 5 0s will be received for the same sequence of 10 digits?arrow_forward
arrow_back_ios
SEE MORE QUESTIONS
arrow_forward_ios
Recommended textbooks for you
 Glencoe Algebra 1, Student Edition, 9780079039897...AlgebraISBN:9780079039897Author:CarterPublisher:McGraw Hill
 Holt Mcdougal Larson Pre-algebra: Student Edition...AlgebraISBN:9780547587776Author:HOLT MCDOUGALPublisher:HOLT MCDOUGAL
 Big Ideas Math A Bridge To Success Algebra 1: Stu...AlgebraISBN:9781680331141Author:HOUGHTON MIFFLIN HARCOURTPublisher:Houghton Mifflin Harcourt
 College Algebra (MindTap Course List)AlgebraISBN:9781305652231Author:R. David Gustafson, Jeff HughesPublisher:Cengage Learning
 Functions and Change: A Modeling Approach to Coll...AlgebraISBN:9781337111348Author:Bruce Crauder, Benny Evans, Alan NoellPublisher:Cengage Learning
 Algebra: Structure And Method, Book 1AlgebraISBN:9780395977224Author:Richard G. Brown, Mary P. Dolciani, Robert H. Sorgenfrey, William L. ColePublisher:McDougal Littell
Glencoe Algebra 1, Student Edition, 9780079039897...
Algebra
ISBN:9780079039897
Author:Carter
Publisher:McGraw Hill
Holt Mcdougal Larson Pre-algebra: Student Edition...
Algebra
ISBN:9780547587776
Author:HOLT MCDOUGAL
Publisher:HOLT MCDOUGAL
Big Ideas Math A Bridge To Success Algebra 1: Stu...
Algebra
ISBN:9781680331141
Author:HOUGHTON MIFFLIN HARCOURT
Publisher:Houghton Mifflin Harcourt
College Algebra (MindTap Course List)
Algebra
ISBN:9781305652231
Author:R. David Gustafson, Jeff Hughes
Publisher:Cengage Learning
Functions and Change: A Modeling Approach to Coll...
Algebra
ISBN:9781337111348
Author:Bruce Crauder, Benny Evans, Alan Noell
Publisher:Cengage Learning
Algebra: Structure And Method, Book 1
Algebra
ISBN:9780395977224
Author:Richard G. Brown, Mary P. Dolciani, Robert H. Sorgenfrey, William L. Cole
Publisher:McDougal Littell
How to make Frequency Distribution Table / Tally Marks and Frequency Distribution Table; Author: Reenu Math;https://www.youtube.com/watch?v=i_A6RiE8tLE;License: Standard YouTube License, CC-BY
Frequency distribution table in statistics; Author: Math and Science;https://www.youtube.com/watch?v=T7KYO76DoOE;License: Standard YouTube License, CC-BY
Frequency Distribution Table for Grouped/Continuous data | Math Dot Com; Author: Maths dotcom;https://www.youtube.com/watch?v=ErnccbXQOPY;License: Standard Youtube License