
Introductory Statistics
1st Edition
ISBN: 9781938168208
Author: Barbara Illowsky, Susan Dean
Publisher: OpenStax College
expand_more
expand_more
format_list_bulleted
Concept explainers
Videos
Textbook Question
Chapter 2, Problem 73P
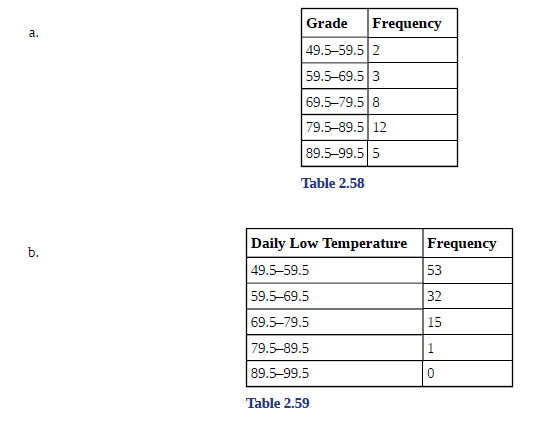
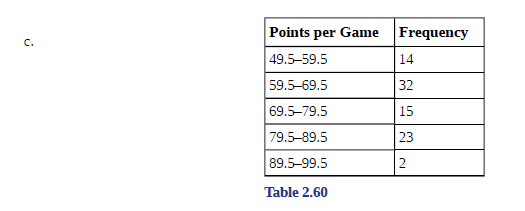
Find the standard deviation for the following frequency tables using the formula. Check the calculations with the TI 83 /84.
Expert Solution & Answer

Trending nowThis is a popular solution!

Students have asked these similar questions
Business discuss
Spam filters are built on principles similar to those used in logistic regression. We fit a probability that each message is spam or not spam. We have several variables for each email. Here are a few: to_multiple=1 if there are multiple recipients, winner=1 if the word 'winner' appears in the subject line, format=1 if the email is poorly formatted, re_subj=1 if "re" appears in the subject line. A logistic model was fit to a dataset with the following output:
Estimate
SE
Z
Pr(>|Z|)
(Intercept)
-0.8161
0.086
-9.4895
0
to_multiple
-2.5651
0.3052
-8.4047
0
winner
1.5801
0.3156
5.0067
0
format
-0.1528
0.1136
-1.3451
0.1786
re_subj
-2.8401
0.363
-7.824
0
(a) Write down the model using the coefficients from the model fit.log_odds(spam) = -0.8161 + -2.5651 + to_multiple + 1.5801 winner + -0.1528 format + -2.8401 re_subj(b) Suppose we have an observation where to_multiple=0, winner=1, format=0, and re_subj=0. What is the predicted probability that this message is spam?…
Consider an event X comprised of three outcomes whose probabilities are 9/18, 1/18,and 6/18.
Compute the probability of the complement of the event.
Question content area bottom
Part 1
A.1/2
B.2/18
C.16/18
D.16/3
Chapter 2 Solutions
Introductory Statistics
Ch. 2 - For the Park City basketball team, scores for the...Ch. 2 - The following data show the distances (in miles)...Ch. 2 - The table shows the number of sins and losses the...Ch. 2 - In a survey, 40 people were asked how many times...Ch. 2 - The population in Park City is made up of...Ch. 2 - Park city is broken down into six voting...Ch. 2 - The following data are the shoe sizes of 50 male...Ch. 2 - The following data are the number of sports played...Ch. 2 - The following data represent the number of...Ch. 2 - Construct a frequency polygon of U.S. Presidents’...
Ch. 2 - The following table is a portion of a data set...Ch. 2 - For the following 11 salaries, calculate the IQR...Ch. 2 - Find the interquartile range for the following two...Ch. 2 - Forty bus drivers were asked how many hours they...Ch. 2 - Refer to the Table 223. Find the third quartile....Ch. 2 - Listed are 29 ages for Academy Award sinning best...Ch. 2 - Listed are 30 ages for Academy Award winning best...Ch. 2 - For the 100-meter dash, the third quartile for...Ch. 2 - On a 60 point written assignment, the 80th...Ch. 2 - During a season, the 40th percentile for points...Ch. 2 - The following data are the number of pages In 40...Ch. 2 - The folloising data set show’s the heights in...Ch. 2 - Follow the steps you used to graph a...Ch. 2 - The following data show the number of months...Ch. 2 - In a sample of 60 households, one house is worth...Ch. 2 - The number of books checked out from the library...Ch. 2 - Five credit scores are 680, 680, 700, 720, 720....Ch. 2 - Mails conducted a study on the effect that playing...Ch. 2 - Discuss the mean, median, and mode for each of the...Ch. 2 - On a baseball team, the ages of each of the...Ch. 2 - The following data show the different types of pet...Ch. 2 - Find the standard deviation for the data from the...Ch. 2 - Two swimmers, Angie and Beth, from different...Ch. 2 - For each of the following data sets, create a stem...Ch. 2 - For each of the following data sets, create a stem...Ch. 2 - For each of the following data sets, create a stem...Ch. 2 - For each of the following data sets, create a stem...Ch. 2 - For each of the following data sets, create a stem...Ch. 2 - For each of the following data sets, create a stem...Ch. 2 - For each of the following data sets, create a stem...Ch. 2 - The students in Ms. Ramirez’s math class have...Ch. 2 - Using the data from Mrs. Ramirez’s math class...Ch. 2 - David County has six high schools. Each school...Ch. 2 - Use the data from the David County science...Ch. 2 - Sixty-five randomly selected car salespersons were...Ch. 2 - What does the frequency column in Table 2.42 sum...Ch. 2 - What does the relative frequency column in Table...Ch. 2 - What is the difference between relative frequency...Ch. 2 - What is the difference between cumulative relative...Ch. 2 - To construct the histogram for the data in Table...Ch. 2 -
Ch. 2 - Construct a frequency polygon from the frequency...Ch. 2 - Use the two frequency tables to compare the life...Ch. 2 - Construct a times series graph for (a) the number...Ch. 2 - The following data sets List full time police per...Ch. 2 - Listed are 29 ages for Academy Award winning best...Ch. 2 - Listed are 32 ages for Academy Award winning best...Ch. 2 - Jesse was ranked 37th in his graduating class of...Ch. 2 - a. For runners in a race, a low time means a...Ch. 2 - a. For runners in a race, a higher speed means a...Ch. 2 - On an exam, would it be more desirable to earn a...Ch. 2 - Mina is waiting in line at the Department of Motor...Ch. 2 - In a survey collecting data about the salaries...Ch. 2 - In a study collecting data about the repair costs...Ch. 2 - The University of California has two criteria used...Ch. 2 - Suppose that you are buying a house. You and your...Ch. 2 - First quartile = _______Ch. 2 - Second quartile = median = 50th percentile =Ch. 2 - Third quartile = _______Ch. 2 - Interquartile range (IQR) = _____ — _____Ch. 2 - Inteiquartile range (IQR = _____ — _____ = _____...Ch. 2 - percentile = _______Ch. 2 - Use the following information to answer the next...Ch. 2 - Use the following information to answer the next...Ch. 2 - Find the mean for the following frequency tables.Ch. 2 - Use the following information to answer the next...Ch. 2 - Use the following information to answer the next...Ch. 2 - Use the following information to answer the next...Ch. 2 - Use the following information to answer the next...Ch. 2 - Use the following information to answer the next...Ch. 2 - Use the following information to answer the next...Ch. 2 - Use the following information to answer the next...Ch. 2 - Use the following information to answer the next...Ch. 2 - Use the following information to answer the next...Ch. 2 - When the data are skewed left, what is the typical...Ch. 2 - When the data are symmetrical, what is the typical...Ch. 2 - What word describes a distribution that has two...Ch. 2 - Describe the shape of this distribution. Figure...Ch. 2 - Describe the relationship between the mode and the...Ch. 2 - Describe the relationship between the mean and the...Ch. 2 - Describe the shape of this distribution. Figure...Ch. 2 - Describe the relationship between the mode and the...Ch. 2 - Are the mean and the median the exact same in this...Ch. 2 - Describe the shape of this distribution. Figure...Ch. 2 - Describe the relationship between the mode and the...Ch. 2 - Describe the relationship between the mean and the...Ch. 2 - The mean and median for the data are the same. 3;...Ch. 2 - Which is the greatest, the mean, the mode, or the...Ch. 2 - Which is the least, the mean, the mode, and the...Ch. 2 - Of the three measures, which tends to reflect...Ch. 2 - In a perfectly symmetrical distribution, when...Ch. 2 - Use the following information to answer the next...Ch. 2 - Use the following information to answer the next...Ch. 2 - Two baseball players, Fredo and Karl, on different...Ch. 2 - Use Table 2.57 to find the value that is three...Ch. 2 - Find the standard deviation for the following...Ch. 2 - Student grades on a chemistry exam were: 77, 78,...Ch. 2 - Table 2.61 contains the 2010 obesity rates in U.S....Ch. 2 - Suppose that three book publishers were interested...Ch. 2 - Often, cruise ships conduct all on-board...Ch. 2 - Twenty-five randomly selected students were asked...Ch. 2 - The percentage of people who own at most three...Ch. 2 - If the data were collected by asking the first 111...Ch. 2 - Following are the 2010 obesity rates by U.S....Ch. 2 - The median age for U.S. blacks currently is 30.9...Ch. 2 - Six hundred adult Americans were asked by...Ch. 2 - Given the following box plot: Figure 2.41 a. which...Ch. 2 - The following box plot shows the U.S. population...Ch. 2 - In a survey of 2O-year-olds in China, Germany, and...Ch. 2 - Given the following box plot, answer the...Ch. 2 - Given the following box plots, answer t*...Ch. 2 - A survey was conducted of 130 purchases of new BMW...Ch. 2 - Twenty-five randomly selected students were asked...Ch. 2 - The most obese countries in the world have obesity...Ch. 2 - Table 2.72 gives the percent of children under...Ch. 2 - The median age of the U.S. population in 1980 was...Ch. 2 - Use the following information to answer the neat...Ch. 2 - Use the following information to answer the neat...Ch. 2 - Use the following information to answer the neat...Ch. 2 - Use the following information to answer the neat...Ch. 2 - Use the following information to answer the neat...Ch. 2 - Use the following information to answer the neat...Ch. 2 - Use the following information to answer the neat...Ch. 2 - Use the following information to answer the neat...Ch. 2 - Use the following information to answer the neat...Ch. 2 - Three students were applying to the same graduate...Ch. 2 - A music school has budgeted to purchase three...Ch. 2 - An elementary school class ran one mile with a...Ch. 2 - The most obese countries in the world have obesity...Ch. 2 - Table 2.76 gives the percent of children under...Ch. 2 - Santa, Clara Country, Ca, has approximately 27,873...Ch. 2 - Javier and Ercilia are supervisors at a shopping...Ch. 2 - What is the IQR? a. 8 b. 11 C. 15 d. 35Ch. 2 - What is the mode? a. 19 b. 19.5 c. 1and 20 d....Ch. 2 - Is this a sample or the entire population? a....Ch. 2 - Twenty-five randomly selected students were asked...Ch. 2 - Forty randomly selected students were asked the...Ch. 2 - Following are the published weights (in pounds) of...Ch. 2 - One hundred teachers attended a seminar on...Ch. 2 - Refer to Figure 2.50 determine which of the...Ch. 2 - In a recent issue of the IFFF Spectrum, 84...Ch. 2 - A survey of enrollment at 35 community colleges...Ch. 2 - Use the following information to answer the next...Ch. 2 - Use the following information to answer the not...Ch. 2 - Suppose that a publisher conducted a survey asking...
Additional Math Textbook Solutions
Find more solutions based on key concepts
CHECK POINT 1 Write a word description of the set L = {a, b, c, d, e, f}.
Thinking Mathematically (6th Edition)
Suppose you toss one coin three times in a row and get heads, tails, heads (HTH). If you are interested in the ...
Using and Understanding Mathematics: A Quantitative Reasoning Approach (6th Edition)
21. Touch Therapy When she was 9 years of age, Emily Rosa did a science fair experiment in which she tested pro...
Elementary Statistics (13th Edition)
A student has to sell 2 books from a collection of 6 math, 7 science, and 4 economics books. How many choices a...
A First Course in Probability (10th Edition)
In hypothesis testing, the common level of significance is =0.05. Some might argue for a level of significance ...
Basic Business Statistics, Student Value Edition
Knowledge Booster


Learn more about
Need a deep-dive on the concept behind this application? Look no further. Learn more about this topic, statistics and related others by exploring similar questions and additional content below.Similar questions
- John and Mike were offered mints. What is the probability that at least John or Mike would respond favorably? (Hint: Use the classical definition.) Question content area bottom Part 1 A.1/2 B.3/4 C.1/8 D.3/8arrow_forwardThe details of the clock sales at a supermarket for the past 6 weeks are shown in the table below. The time series appears to be relatively stable, without trend, seasonal, or cyclical effects. The simple moving average value of k is set at 2. What is the simple moving average root mean square error? Round to two decimal places. Week Units sold 1 88 2 44 3 54 4 65 5 72 6 85 Question content area bottom Part 1 A. 207.13 B. 20.12 C. 14.39 D. 0.21arrow_forwardThe details of the clock sales at a supermarket for the past 6 weeks are shown in the table below. The time series appears to be relatively stable, without trend, seasonal, or cyclical effects. The simple moving average value of k is set at 2. If the smoothing constant is assumed to be 0.7, and setting F1 and F2=A1, what is the exponential smoothing sales forecast for week 7? Round to the nearest whole number. Week Units sold 1 88 2 44 3 54 4 65 5 72 6 85 Question content area bottom Part 1 A. 80 clocks B. 60 clocks C. 70 clocks D. 50 clocksarrow_forward
- The details of the clock sales at a supermarket for the past 6 weeks are shown in the table below. The time series appears to be relatively stable, without trend, seasonal, or cyclical effects. The simple moving average value of k is set at 2. Calculate the value of the simple moving average mean absolute percentage error. Round to two decimal places. Week Units sold 1 88 2 44 3 54 4 65 5 72 6 85 Part 1 A. 14.39 B. 25.56 C. 23.45 D. 20.90arrow_forwardThe accompanying data shows the fossil fuels production, fossil fuels consumption, and total energy consumption in quadrillions of BTUs of a certain region for the years 1986 to 2015. Complete parts a and b. Year Fossil Fuels Production Fossil Fuels Consumption Total Energy Consumption1949 28.748 29.002 31.9821950 32.563 31.632 34.6161951 35.792 34.008 36.9741952 34.977 33.800 36.7481953 35.349 34.826 37.6641954 33.764 33.877 36.6391955 37.364 37.410 40.2081956 39.771 38.888 41.7541957 40.133 38.926 41.7871958 37.216 38.717 41.6451959 39.045 40.550 43.4661960 39.869 42.137 45.0861961 40.307 42.758 45.7381962 41.732 44.681 47.8261963 44.037 46.509 49.6441964 45.789 48.543 51.8151965 47.235 50.577 54.0151966 50.035 53.514 57.0141967 52.597 55.127 58.9051968 54.306 58.502 62.4151969 56.286…arrow_forwardThe accompanying data shows the fossil fuels production, fossil fuels consumption, and total energy consumption in quadrillions of BTUs of a certain region for the years 1986 to 2015. Complete parts a and b. Year Fossil Fuels Production Fossil Fuels Consumption Total Energy Consumption1949 28.748 29.002 31.9821950 32.563 31.632 34.6161951 35.792 34.008 36.9741952 34.977 33.800 36.7481953 35.349 34.826 37.6641954 33.764 33.877 36.6391955 37.364 37.410 40.2081956 39.771 38.888 41.7541957 40.133 38.926 41.7871958 37.216 38.717 41.6451959 39.045 40.550 43.4661960 39.869 42.137 45.0861961 40.307 42.758 45.7381962 41.732 44.681 47.8261963 44.037 46.509 49.6441964 45.789 48.543 51.8151965 47.235 50.577 54.0151966 50.035 53.514 57.0141967 52.597 55.127 58.9051968 54.306 58.502 62.4151969 56.286…arrow_forward
- The accompanying data shows the fossil fuels production, fossil fuels consumption, and total energy consumption in quadrillions of BTUs of a certain region for the years 1986 to 2015. Complete parts a and b. Develop line charts for each variable and identify the characteristics of the time series (that is, random, stationary, trend, seasonal, or cyclical). What is the line chart for the variable Fossil Fuels Production?arrow_forwardThe accompanying data shows the fossil fuels production, fossil fuels consumption, and total energy consumption in quadrillions of BTUs of a certain region for the years 1986 to 2015. Complete parts a and b. Year Fossil Fuels Production Fossil Fuels Consumption Total Energy Consumption1949 28.748 29.002 31.9821950 32.563 31.632 34.6161951 35.792 34.008 36.9741952 34.977 33.800 36.7481953 35.349 34.826 37.6641954 33.764 33.877 36.6391955 37.364 37.410 40.2081956 39.771 38.888 41.7541957 40.133 38.926 41.7871958 37.216 38.717 41.6451959 39.045 40.550 43.4661960 39.869 42.137 45.0861961 40.307 42.758 45.7381962 41.732 44.681 47.8261963 44.037 46.509 49.6441964 45.789 48.543 51.8151965 47.235 50.577 54.0151966 50.035 53.514 57.0141967 52.597 55.127 58.9051968 54.306 58.502 62.4151969 56.286…arrow_forwardFor each of the time series, construct a line chart of the data and identify the characteristics of the time series (that is, random, stationary, trend, seasonal, or cyclical). Month PercentApr 1972 4.97May 1972 5.00Jun 1972 5.04Jul 1972 5.25Aug 1972 5.27Sep 1972 5.50Oct 1972 5.73Nov 1972 5.75Dec 1972 5.79Jan 1973 6.00Feb 1973 6.02Mar 1973 6.30Apr 1973 6.61May 1973 7.01Jun 1973 7.49Jul 1973 8.30Aug 1973 9.23Sep 1973 9.86Oct 1973 9.94Nov 1973 9.75Dec 1973 9.75Jan 1974 9.73Feb 1974 9.21Mar 1974 8.85Apr 1974 10.02May 1974 11.25Jun 1974 11.54Jul 1974 11.97Aug 1974 12.00Sep 1974 12.00Oct 1974 11.68Nov 1974 10.83Dec 1974 10.50Jan 1975 10.05Feb 1975 8.96Mar 1975 7.93Apr 1975 7.50May 1975 7.40Jun 1975 7.07Jul 1975 7.15Aug 1975 7.66Sep 1975 7.88Oct 1975 7.96Nov 1975 7.53Dec 1975 7.26Jan 1976 7.00Feb 1976 6.75Mar 1976 6.75Apr 1976 6.75May 1976…arrow_forward
- Hi, I need to make sure I have drafted a thorough analysis, so please answer the following questions. Based on the data in the attached image, develop a regression model to forecast the average sales of football magazines for each of the seven home games in the upcoming season (Year 10). That is, you should construct a single regression model and use it to estimate the average demand for the seven home games in Year 10. In addition to the variables provided, you may create new variables based on these variables or based on observations of your analysis. Be sure to provide a thorough analysis of your final model (residual diagnostics) and provide assessments of its accuracy. What insights are available based on your regression model?arrow_forwardI want to make sure that I included all possible variables and observations. There is a considerable amount of data in the images below, but not all of it may be useful for your purposes. Are there variables contained in the file that you would exclude from a forecast model to determine football magazine sales in Year 10? If so, why? Are there particular observations of football magazine sales from previous years that you would exclude from your forecasting model? If so, why?arrow_forwardStat questionsarrow_forward
arrow_back_ios
SEE MORE QUESTIONS
arrow_forward_ios
Recommended textbooks for you
 Glencoe Algebra 1, Student Edition, 9780079039897...AlgebraISBN:9780079039897Author:CarterPublisher:McGraw Hill
 College Algebra (MindTap Course List)AlgebraISBN:9781305652231Author:R. David Gustafson, Jeff HughesPublisher:Cengage Learning
 Holt Mcdougal Larson Pre-algebra: Student Edition...AlgebraISBN:9780547587776Author:HOLT MCDOUGALPublisher:HOLT MCDOUGAL
 Big Ideas Math A Bridge To Success Algebra 1: Stu...AlgebraISBN:9781680331141Author:HOUGHTON MIFFLIN HARCOURTPublisher:Houghton Mifflin Harcourt
Glencoe Algebra 1, Student Edition, 9780079039897...
Algebra
ISBN:9780079039897
Author:Carter
Publisher:McGraw Hill
College Algebra (MindTap Course List)
Algebra
ISBN:9781305652231
Author:R. David Gustafson, Jeff Hughes
Publisher:Cengage Learning
Holt Mcdougal Larson Pre-algebra: Student Edition...
Algebra
ISBN:9780547587776
Author:HOLT MCDOUGAL
Publisher:HOLT MCDOUGAL
Big Ideas Math A Bridge To Success Algebra 1: Stu...
Algebra
ISBN:9781680331141
Author:HOUGHTON MIFFLIN HARCOURT
Publisher:Houghton Mifflin Harcourt
The Shape of Data: Distributions: Crash Course Statistics #7; Author: CrashCourse;https://www.youtube.com/watch?v=bPFNxD3Yg6U;License: Standard YouTube License, CC-BY
Shape, Center, and Spread - Module 20.2 (Part 1); Author: Mrmathblog;https://www.youtube.com/watch?v=COaid7O_Gag;License: Standard YouTube License, CC-BY
Shape, Center and Spread; Author: Emily Murdock;https://www.youtube.com/watch?v=_YyW0DSCzpM;License: Standard Youtube License