
Videos
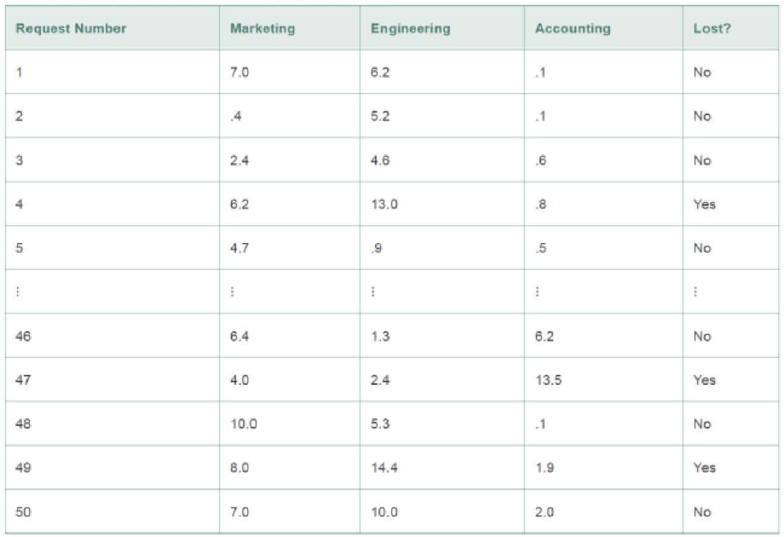
Time to develop price quotes. A manufacturer of industrial wheels is losing many profitable orders because of the long time it takes the firm's marketing, engineering, and accounting departments to develop price quotes for potential customers. To remedy this problem, the firm’s management would like to set guidelines for the length of time each department should spend developing price quotes. To help develop these guidelines, 50 requests for price quotes were randomly selected from the set of price quotes made last year: the processing time (in days) was determined for each price quote for each department. Several observations are displayed in the table below. The price quotes are also classified by whether or not they were “lost” (i.e., whether or not the customer placed an order after receiving the price quote).
- a. Construct a stem-and-leaf display for the total processing time for each department. Shade the leaves that correspond to “lost” orders in each of the displays, and interpret each of the displays.
- b. Using your results from part a, develop “maximum processing time” guidelines for each department that, if followed, will help the firm reduce the number of lost orders.
- c. Generate summary statistics for the processing times. Interpret the results.
- d. Calculate the z-score corresponding to the maximum processing time guideline you developed in part b for each department, and for the total processing time.
- e. Calculate the maximum processing time corresponding to a z-score of 3 for each of the departments. What percentage of the orders exceed these guidelines? How does this agree with Chebyshev’s Rule and the
Empirical Rule ? - f. Repeat parte using a z-score of 2.
- g. Compare the percentage of “lost” quotes with corresponding times that exceed at least one of the guidelines in part e to the same percentage using the guidelines in part f. Which set of guidelines would you recommend be adopted? Why?
Want to see the full answer?
Check out a sample textbook solution
Chapter 2 Solutions
Statistics for Business and Economics (13th Edition)
Additional Math Textbook Solutions
University Calculus: Early Transcendentals (4th Edition)
Elementary Algebra For College Students (10th Edition)
Elementary Statistics: Picturing the World (7th Edition)
A Problem Solving Approach To Mathematics For Elementary School Teachers (13th Edition)
Introductory Statistics
Algebra and Trigonometry (6th Edition)


- Suppose there is a new preventative treatment for a common disease. If you take the preventative treatment, it reduces the average amount of time you spend sick by 10%. The optimal combination of Z (home goods) and H (health goods). both may increase both may increase or one may stay the same while the other increases. both may decrease H may increase; Z may not change Z may increase; H may decreasearrow_forwardIn the Bismarck system,. may arise. neither selection both adverse and risk selection ☑ adverse selection risk selectionarrow_forwardPls fill out/explain to me these notes and explanations, thanksarrow_forward
- Simple explanations plsarrow_forwardThis question examines the relationship between the Indian rupee (Rs) and the US dollar ($). We denote the exchange rate in rupees per dollar as ERS/$. Suppose the Bank of India permanently decreases its money supply by 4%. 1. First, consider the effect in the long run. Using the following equation, explain how the change in India's money supply affects the Indian price level, PIN, and the exchange rate, ERS/$: AERS/STIN ERS/$ - ·TUS = (MIN - 9IN) - (Mus - gus). MIN 2. How does the decrease in India's money supply affect the real money supply, in the long PIN run. 3. Based on your previous answer, how does the decrease in the Indian money supply affect the nominal interest rate, UN, in the long run? (hint: M = L(i)Y hold in the long run) 4. Illustrate the graphs to show how a permanent decrease in India's money supply affects India's money and FX markets in the long run. (hint: you may refer to the figures on lecture slides #5, titled "Analysis in the long run.") 5. Illustrate the…arrow_forwardPlease explain the concept/what this fill in graph, thanksarrow_forward
 Managerial Economics: Applications, Strategies an...EconomicsISBN:9781305506381Author:James R. McGuigan, R. Charles Moyer, Frederick H.deB. HarrisPublisher:Cengage Learning
 Managerial Economics: A Problem Solving ApproachEconomicsISBN:9781337106665Author:Luke M. Froeb, Brian T. McCann, Michael R. Ward, Mike ShorPublisher:Cengage Learning
 Economics (MindTap Course List)EconomicsISBN:9781337617383Author:Roger A. ArnoldPublisher:Cengage Learning
 Economics Today and Tomorrow, Student EditionEconomicsISBN:9780078747663Author:McGraw-HillPublisher:Glencoe/McGraw-Hill School Pub Co