
Concept explainers
Videos
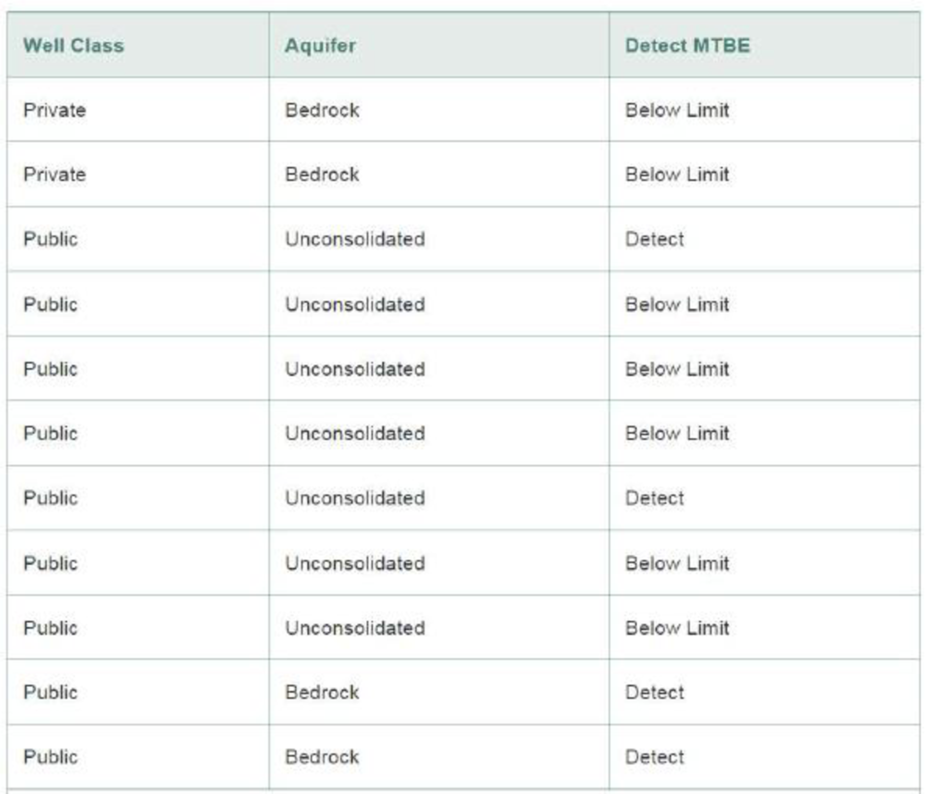
Groundwater contamination in wells. In New Hampshire, about half the counties mandate the use of reformulated gasoline. This has led to an increase in the contamination of groundwater with methyl tert-butyl ether (MTBE). Environmental Science & Technology (Jan. 2005) reported on the factors related to MTBE contamination in public and private New Hampshire wells. Data were collected for a sample of 223 wells. Three of the variables are qualitative in nature: well class (public or private), aquifer (bedrock or unconsolidated), and detectible level of MTBE (below limit or detect). [Note: A detectible level of MTBE occurs if the MTBE value exceeds .2 micrograms per liter.] The data for 11 selected wells are shown in the accompanying table.
- a. Use graphical methods to describe each of the three qualitative variables for all 223 wells.
- b. Use side-by-side bar charts to compare the proportions of contaminated wells for private and public well classes.
- c. Use side-by-side bar charts to compare the proportions of contaminated wells for bedrock and unconsolidated aquifers.
- d. What inferences can be made from the bar charts, parts a-c?
Want to see the full answer?
Check out a sample textbook solution
Chapter 2 Solutions
Statistics for Business and Economics (13th Edition)


- Suppose that you have a normal population of quiz scores with mean 40 and standard deviation 10. Select a random sample of 40. What’s the chance that the mean of the quiz scores won’t exceed 45?Select one individual from the population. What’s the chance that his/her quiz score won’t exceed 45?arrow_forwardSuppose that you take a sample of 100 from a population that contains 45 percent Democrats. What sample size condition do you need to check here (if any)?What’s the standard error of ^P?Compare the standard errors of ^p n=100 for ,n=1000 , n=10,000, and comment.arrow_forwardSuppose that a class’s test scores have a mean of 80 and standard deviation of 5. You choose 25 students from the class. What’s the chance that the group’s average test score is more than 82?arrow_forward
- Suppose that you collect data on 10 products and check their weights. The average should be 10 ounces, but your sample mean is 9 ounces with standard deviation 2 ounces. Find the standard score.What percentile is the standard score found in part a of this question closest to?Suppose that the mean really is 10 ounces. Do you find these results unusual? Use probabilities to explain.arrow_forwardSuppose that you want to sample expensive computer chips, but you can have only n=3 of them. Should you continue the experiment?arrow_forwardSuppose that studies claim that 40 percent of cellphone owners use their phones in the car while driving. What’s the chance that more than 425 out of a random sample of 1,000 cellphone owners say they use their phones while driving?arrow_forward
- Suppose that the average length of stay in Europe for American tourists is 17 days, with standard deviation 4.5. You choose a random sample of 16 American tourists. The sample of 16 stay an average of 18.5 days or more. What’s the chance of that happening?arrow_forwardHow do you recognize that a statistical problem requires you to use the CLT? Think of one or two clues you can look for. (Assume quantitative data.)arrow_forwardSuppose that you take a sample of 100 from a skewed population with mean 50 and standard deviation 15. What sample size condition do you need to check here (if any)?What’s the shape and center of the sampling distribution for ?What’s the standard error?arrow_forward
- Question 3 The following stem-and-leaf displays the weekly salary of employees at this firm. Stem-and-Leaf Display Leaf Unit = 10.0 N=x 5 3 00123 12 4 0125888 (y) 5 11234456777 z 6 13568 5 7 154 2 8 46 i. Determine the value of x, y and z. [3] ii. What is the value of the median? [2] iii. Find the mode of this data set. iv. Calculate the range [1] [2]arrow_forwardLet Y be a continuous RV with PDF otherwise Find the CDF, Fry), of Y . Find an expression for pth, p € (0, 1), quantile of the distribution. Find E(Y) and V(Y). Find E(-2Y + 1) and V(-3Y - 2). Find E(Y3).arrow_forwardLet X be a continuous RV with CDF Find P(X < 0), P(-1 < X < 1) and P(0.5 < X). Based on your answers to the above questions, what is the median of the distribu-tion? Why Find the PDF, fx (x), of X.arrow_forward
 Glencoe Algebra 1, Student Edition, 9780079039897...AlgebraISBN:9780079039897Author:CarterPublisher:McGraw Hill
 Big Ideas Math A Bridge To Success Algebra 1: Stu...AlgebraISBN:9781680331141Author:HOUGHTON MIFFLIN HARCOURTPublisher:Houghton Mifflin Harcourt