
Statistics for Business and Economics (13th Edition)
13th Edition
ISBN: 9780134506593
Author: James T. McClave, P. George Benson, Terry Sincich
Publisher: PEARSON
expand_more
expand_more
format_list_bulleted
Concept explainers
Videos
Textbook Question
Chapter 2.2, Problem 2.19LM
Refer to Exercise 2.18. Calculate the number of the 500 measurements falling into each of the measurement classes. Then graph a frequency histogram for these data.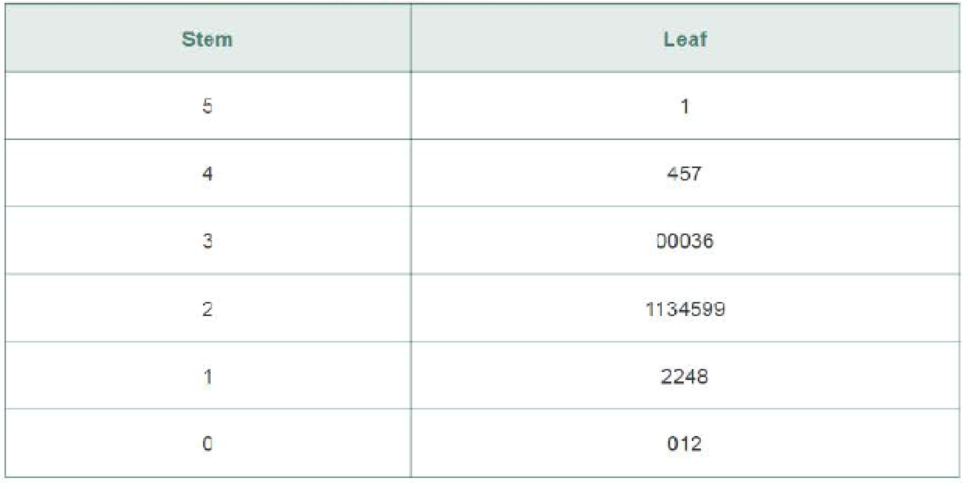
Expert Solution & Answer
Want to see the full answer?
Check out a sample textbook solution
Students have asked these similar questions
Question 2. An American option on a stock has payoff given by F = f(St) when it is exercised
at time t. We know that the function f is convex. A person claims that because of convexity,
it is optimal to exercise at expiration T. Do you agree with them?
Question 4. We consider a CRR model with So == 5 and up and down factors u = 1.03 and
d = 0.96. We consider the interest rate r = 4% (over one period). Is this a suitable CRR
model? (Explain your answer.)
Question 3. We want to price a put option with strike price K and expiration T. Two financial
advisors estimate the parameters with two different statistical methods: they obtain the same
return rate μ, the same volatility σ, but the first advisor has interest r₁ and the second advisor
has interest rate r2 (r1>r2). They both use a CRR model with the same number of periods to
price the option. Which advisor will get the larger price? (Explain your answer.)
Chapter 2 Solutions
Statistics for Business and Economics (13th Edition)
Ch. 2.1 - Complete the following table.Ch. 2.1 - A qualitative variable with three classes (X, Y,...Ch. 2.1 - STEM experiences for girls. The National Science...Ch. 2.1 - Cable TV subscriptions and cord cutters. Has the...Ch. 2.1 - Do social robots walk or roll? A social (or...Ch. 2.1 - Top credit card issuers, by region. The Nilson...Ch. 2.1 - Microsoft program security issues. To help its...Ch. 2.1 - Jamming attacks on wireless networks. Refer to the...Ch. 2.1 - The Apprentice contestants performance ratings....Ch. 2.1 - The economic return to earning an MBA. Refer to...
Ch. 2.1 - Profiling UK rental malls. An analysis of the...Ch. 2.1 - History of corporate acquisitions. A corporate...Ch. 2.1 - Twitter opinions of iPhone 6 features. What are...Ch. 2.1 - Museum management. What criteria do museums use to...Ch. 2.1 - Advertising with reader-response cards....Ch. 2.1 - Motivation and right-oriented bias. Evolutionary...Ch. 2.1 - Groundwater contamination in wells. In New...Ch. 2.2 - Graph the relative frequency histogram for the 500...Ch. 2.2 - Refer to Exercise 2.18. Calculate the number of...Ch. 2.2 - Consider the stem-and-leaf display shown here. a....Ch. 2.2 - Minitab was used to generate the following...Ch. 2.2 - Stability of compounds in new drugs. Testing the...Ch. 2.2 - Corporate sustainability of CPA firms. Refer to...Ch. 2.2 - Sanitation inspection of cruise ships. To minimize...Ch. 2.2 - History of corporate acquisitions. Refer to the...Ch. 2.2 - Most valuable NFL teams. Each year Forbes reports...Ch. 2.2 - State SAT scores. Educators are constantly...Ch. 2.2 - Items arriving and departing a work center. In a...Ch. 2.2 - Crude oil biodegradation. In order to protect...Ch. 2.2 - Volkswagen emissions scandal. Recently, the...Ch. 2.2 - Is honey a cough remedy? Does a teaspoon of honey...Ch. 2.2 - Time in bankruptcy. Financially distressed firms...Ch. 2.2 - Prob. 2.33ACACh. 2.2 - Prob. 2.34ACACh. 2.3 - Calculate the mean and median of the following...Ch. 2.3 - Calculate the mean for samples where a. n = 10, x...Ch. 2.3 - Explain how the relationship between the mean and...Ch. 2.3 - Explain the difference between the calculation of...Ch. 2.3 - Calculate the mode, mean, and median of the...Ch. 2.3 - Calculate the mean, median, and mode for each of...Ch. 2.3 - Describe how the mean compares to the median for a...Ch. 2.3 - Use the applet entitled Mean versus Median to find...Ch. 2.3 - Prob. 2.2AECh. 2.3 - Use the applet Mean versus Median to study the...Ch. 2.3 - Hotels use of ecolabels. Ecolabels such as Energy...Ch. 2.3 - Rankings of research universities. Based on...Ch. 2.3 - Performance of stock screeners. Investment...Ch. 2.3 - Performance-based logistics. Refer to the Journal...Ch. 2.3 - Surface roughness of oil field pipe. Oil field...Ch. 2.3 - Prob. 2.47ACICh. 2.3 - Corporate sustainability of CPA firms. Refer to...Ch. 2.3 - Is honey a cough remedy? Refer to the Archives of...Ch. 2.3 - Crude oil biodegradation. Refer to the Journal of...Ch. 2.3 - Symmetric or skewed? Would you expect the data...Ch. 2.3 - Prob. 2.52ACICh. 2.3 - Prob. 2.53ACACh. 2.3 - Prob. 2.54ACACh. 2.3 - Prob. 2.55ACACh. 2.4 - Answer the following questions about variability...Ch. 2.4 - Calculate the range, variance, and standard...Ch. 2.4 - Calculate the variance and standard deviation for...Ch. 2.4 - Compute x,s2, and s for each of the following data...Ch. 2.4 - Calculate the range, variance, and standard...Ch. 2.4 - Using only integers between 0 and 10, construct...Ch. 2.4 - Using only integers between 0 and 10, construct...Ch. 2.4 - Consider the following sample of five...Ch. 2.4 - Use the applet entitled Standard Deviation to find...Ch. 2.4 - Use the applet Standard Deviation to study the...Ch. 2.4 - Use the applet Standard Deviation to study the...Ch. 2.4 - Hotels use of ecolabels. Refer to the Journal of...Ch. 2.4 - Permeability of sandstone during weathering. Refer...Ch. 2.4 - Performance of stock screeners. Refer to the...Ch. 2.4 - Corporate sustainability of CPA firms. Refer to...Ch. 2.4 - Is honey a cough remedy? Refer to the Archives of...Ch. 2.4 - Active nuclear power plants. Refer to Exercise...Ch. 2.4 - Estimating production time. A widely used...Ch. 2.5 - The output from a statistical software package...Ch. 2.5 - Prob. 2.72LMCh. 2.5 - For a set of data with a mound-shaped relative...Ch. 2.5 - The following is a sample of 25 measurements: a....Ch. 2.5 - Given a data set with a largest value of 760 and a...Ch. 2.5 - Voltage sags and swells. The power quality of a...Ch. 2.5 - Permeability of sandstone during weathering. Refer...Ch. 2.5 - Do social robots walk or roll? Refer to the...Ch. 2.5 - College dropout study. The American Economic...Ch. 2.5 - Motivation of drug dealers. Consider a study of...Ch. 2.5 - Sanitation inspection of cruise ships. Refer to...Ch. 2.5 - Volkswagen emissions scandal. Refer to the...Ch. 2.5 - Auditing water resources in Australia. Australia...Ch. 2.5 - The Apprentice contestants performance ratings....Ch. 2.5 - Shopping vehicle and judgment. While shopping at...Ch. 2.5 - Buy-side vs. sell-side analysts earnings...Ch. 2.5 - Prob. 2.87ACACh. 2.5 - Improving SAT scores. The National Education...Ch. 2.5 - Prob. 2.89ACACh. 2.6 - Compute the z-score corresponding to each of the...Ch. 2.6 - Give the percentage of measurements in a data set...Ch. 2.6 - In terms of percentiles, define QL, QM and QU.Ch. 2.6 - Compare the z-scores to decide which of the...Ch. 2.6 - Suppose that 40 and 90 are two elements of a...Ch. 2.6 - Mathematics assessment test scores. According to...Ch. 2.6 - Prob. 2.96ACBCh. 2.6 - Prob. 2.97ACBCh. 2.6 - Sanitation inspection of cruise ships Refer to the...Ch. 2.6 - Prob. 2.99ACICh. 2.6 - Prob. 2.100ACICh. 2.6 - Executive networking and firm performance. Do...Ch. 2.6 - Blue- vs. red-colored exam study. In a study of...Ch. 2.6 - Ranking PhD programs in economics. Thousands of...Ch. 2.6 - Using z-scores for grades. At one university, the...Ch. 2.6 - Prob. 2.105ACACh. 2.7 - A sample data set has a mean of 57 and a standard...Ch. 2.7 - Suppose a data set consisting of exam scores has a...Ch. 2.7 - Consider the horizontal box plot shown below. a....Ch. 2.7 - Prob. 2.109LMCh. 2.7 - Prob. 2.7AECh. 2.7 - Rankings of research universities. Refer to the...Ch. 2.7 - Voltage sags and swells. Refer to the Electrical...Ch. 2.7 - Treating psoriasis with the Doctorfish of Kangal....Ch. 2.7 - Budget lapsing at army hospitals. Accountants use...Ch. 2.7 - Salary offers to MBAs. Consider the top salary...Ch. 2.7 - Prob. 2.115ACICh. 2.7 - Prob. 2.116ACICh. 2.7 - Sanitation inspection of cruise ships. Referto...Ch. 2.7 - Network server downtime. A manufacturer of network...Ch. 2.7 - Permeability of sandstone during weathering. Refer...Ch. 2.7 - Prob. 2.120ACACh. 2.7 - Prob. 2.121ACACh. 2.8 - Construct a scatterplot for the data in the...Ch. 2.8 - Construct a scatterplot for the data in the...Ch. 2.8 - Prob. 2.124ACBCh. 2.8 - Prob. 2.125ACBCh. 2.8 - Lobster trap placement. Strategic placement of...Ch. 2.8 - Does elevation impact hitting performance in...Ch. 2.8 - Prob. 2.128ACBCh. 2.8 - Prob. 2.129ACBCh. 2.8 - Spreading rate of spilled liquid A contract...Ch. 2.8 - Performance ratings of government agencies. The...Ch. 2.8 - Most valuable NFL teams. Refer to the Forbes...Ch. 2.8 - Best-paid CEOs. Refer to Glassdoor Economic...Ch. 2.8 - Prob. 2.134ACACh. 2.10 - Museum management. Refer to the Museum Management...Ch. 2.10 - Volkswagen emissions scandal. Refer to the...Ch. 2.10 - BP oil leak. In the summer of 2010, an explosion...Ch. 2 - Construet a relative frequency histogram for the...Ch. 2 - Discuss the conditions under which the median is...Ch. 2 - Consider the following three measurements: 50, 70,...Ch. 2 - Refer to Exercise 2.141c. For parts a-d, determine...Ch. 2 - For each of the following data sets, compute x,...Ch. 2 - For each of the following data sets, compute x,...Ch. 2 - Explain why we generally prefer the standard...Ch. 2 - If the range of a set of data is 20, find a rough...Ch. 2 - Prob. 2.147LMCh. 2 - Motivation of drug dealers. Refer to the Applied...Ch. 2 - Slogs for Fortune 500 firms. Web site...Ch. 2 - Management system failures. The U.S. Chemical...Ch. 2 - Business marketing publications....Ch. 2 - U.S. business bankruptcies. The American...Ch. 2 - Prob. 2.153ACBCh. 2 - Products Made in the USA. Made in the USA is a...Ch. 2 - Prob. 2.155ACBCh. 2 - Drivers stopped by police. According to the Bureau...Ch. 2 - U.S. wine export markets. The Center for...Ch. 2 - Prob. 2.158ACICh. 2 - Hull failures of oil tankers. Owing to several...Ch. 2 - Software defects. The Promise Software Engineering...Ch. 2 - Prob. 2.161ACICh. 2 - Time to develop price quotes. A manufacturer of...Ch. 2 - Trend in Iraq War casualties. While the United...Ch. 2 - Prob. 2.164ACICh. 2 - Radiation levels in homes. In some locations,...Ch. 2 - Doctors and ethics. For physicians confronted with...Ch. 2 - Prob. 2.167ACICh. 2 - Investigating the claims of weight-loss clinics....Ch. 2 - Age discrimination study. The Age Discrimination...Ch. 2 - No Child Left Behind Act. According to the...Ch. 2 - Steel rod quality. In his essay Making Things...
Knowledge Booster


Learn more about
Need a deep-dive on the concept behind this application? Look no further. Learn more about this topic, statistics and related others by exploring similar questions and additional content below.Similar questions
- Question 5. We consider a put option with strike price K and expiration T. This option is priced using a 1-period CRR model. We consider r > 0, and σ > 0 very large. What is the approximate price of the option? In other words, what is the limit of the price of the option as σ∞. (Briefly justify your answer.)arrow_forwardQuestion 6. You collect daily data for the stock of a company Z over the past 4 months (i.e. 80 days) and calculate the log-returns (yk)/(-1. You want to build a CRR model for the evolution of the stock. The expected value and standard deviation of the log-returns are y = 0.06 and Sy 0.1. The money market interest rate is r = 0.04. Determine the risk-neutral probability of the model.arrow_forwardSeveral markets (Japan, Switzerland) introduced negative interest rates on their money market. In this problem, we will consider an annual interest rate r < 0. We consider a stock modeled by an N-period CRR model where each period is 1 year (At = 1) and the up and down factors are u and d. (a) We consider an American put option with strike price K and expiration T. Prove that if <0, the optimal strategy is to wait until expiration T to exercise.arrow_forward
- We consider an N-period CRR model where each period is 1 year (At = 1), the up factor is u = 0.1, the down factor is d = e−0.3 and r = 0. We remind you that in the CRR model, the stock price at time tn is modeled (under P) by Sta = So exp (μtn + σ√AtZn), where (Zn) is a simple symmetric random walk. (a) Find the parameters μ and σ for the CRR model described above. (b) Find P Ste So 55/50 € > 1). StN (c) Find lim P 804-N (d) Determine q. (You can use e- 1 x.) Ste (e) Find Q So (f) Find lim Q 004-N StN Soarrow_forwardIn this problem, we consider a 3-period stock market model with evolution given in Fig. 1 below. Each period corresponds to one year. The interest rate is r = 0%. 16 22 28 12 16 12 8 4 2 time Figure 1: Stock evolution for Problem 1. (a) A colleague notices that in the model above, a movement up-down leads to the same value as a movement down-up. He concludes that the model is a CRR model. Is your colleague correct? (Explain your answer.) (b) We consider a European put with strike price K = 10 and expiration T = 3 years. Find the price of this option at time 0. Provide the replicating portfolio for the first period. (c) In addition to the call above, we also consider a European call with strike price K = 10 and expiration T = 3 years. Which one has the highest price? (It is not necessary to provide the price of the call.) (d) We now assume a yearly interest rate r = 25%. We consider a Bermudan put option with strike price K = 10. It works like a standard put, but you can exercise it…arrow_forwardIn this problem, we consider a 2-period stock market model with evolution given in Fig. 1 below. Each period corresponds to one year (At = 1). The yearly interest rate is r = 1/3 = 33%. This model is a CRR model. 25 15 9 10 6 4 time Figure 1: Stock evolution for Problem 1. (a) Find the values of up and down factors u and d, and the risk-neutral probability q. (b) We consider a European put with strike price K the price of this option at time 0. == 16 and expiration T = 2 years. Find (c) Provide the number of shares of stock that the replicating portfolio contains at each pos- sible position. (d) You find this option available on the market for $2. What do you do? (Short answer.) (e) We consider an American put with strike price K = 16 and expiration T = 2 years. Find the price of this option at time 0 and describe the optimal exercising strategy. (f) We consider an American call with strike price K ○ = 16 and expiration T = 2 years. Find the price of this option at time 0 and describe…arrow_forward
- 2.2, 13.2-13.3) question: 5 point(s) possible ubmit test The accompanying table contains the data for the amounts (in oz) in cans of a certain soda. The cans are labeled to indicate that the contents are 20 oz of soda. Use the sign test and 0.05 significance level to test the claim that cans of this soda are filled so that the median amount is 20 oz. If the median is not 20 oz, are consumers being cheated? Click the icon to view the data. What are the null and alternative hypotheses? OA. Ho: Medi More Info H₁: Medi OC. Ho: Medi H₁: Medi Volume (in ounces) 20.3 20.1 20.4 Find the test stat 20.1 20.5 20.1 20.1 19.9 20.1 Test statistic = 20.2 20.3 20.3 20.1 20.4 20.5 Find the P-value 19.7 20.2 20.4 20.1 20.2 20.2 P-value= (R 19.9 20.1 20.5 20.4 20.1 20.4 Determine the p 20.1 20.3 20.4 20.2 20.3 20.4 Since the P-valu 19.9 20.2 19.9 Print Done 20 oz 20 oz 20 oz 20 oz ce that the consumers are being cheated.arrow_forwardT Teenage obesity (O), and weekly fast-food meals (F), among some selected Mississippi teenagers are: Name Obesity (lbs) # of Fast-foods per week Josh 185 10 Karl 172 8 Terry 168 9 Kamie Andy 204 154 12 6 (a) Compute the variance of Obesity, s²o, and the variance of fast-food meals, s², of this data. [Must show full work]. (b) Compute the Correlation Coefficient between O and F. [Must show full work]. (c) Find the Coefficient of Determination between O and F. [Must show full work]. (d) Obtain the Regression equation of this data. [Must show full work]. (e) Interpret your answers in (b), (c), and (d). (Full explanations required). Edit View Insert Format Tools Tablearrow_forwardThe average miles per gallon for a sample of 40 cars of model SX last year was 32.1, with a population standard deviation of 3.8. A sample of 40 cars from this year’s model SX has an average of 35.2 mpg, with a population standard deviation of 5.4. Find a 99 percent confidence interval for the difference in average mpg for this car brand (this year’s model minus last year’s).Find a 99 percent confidence interval for the difference in average mpg for last year’s model minus this year’s. What does the negative difference mean?arrow_forward
- A special interest group reports a tiny margin of error (plus or minus 0.04 percent) for its online survey based on 50,000 responses. Is the margin of error legitimate? (Assume that the group’s math is correct.)arrow_forwardSuppose that 73 percent of a sample of 1,000 U.S. college students drive a used car as opposed to a new car or no car at all. Find an 80 percent confidence interval for the percentage of all U.S. college students who drive a used car.What sample size would cut this margin of error in half?arrow_forwardYou want to compare the average number of tines on the antlers of male deer in two nearby metro parks. A sample of 30 deer from the first park shows an average of 5 tines with a population standard deviation of 3. A sample of 35 deer from the second park shows an average of 6 tines with a population standard deviation of 3.2. Find a 95 percent confidence interval for the difference in average number of tines for all male deer in the two metro parks (second park minus first park).Do the parks’ deer populations differ in average size of deer antlers?arrow_forward
arrow_back_ios
SEE MORE QUESTIONS
arrow_forward_ios
Recommended textbooks for you
 Holt Mcdougal Larson Pre-algebra: Student Edition...AlgebraISBN:9780547587776Author:HOLT MCDOUGALPublisher:HOLT MCDOUGAL
 Glencoe Algebra 1, Student Edition, 9780079039897...AlgebraISBN:9780079039897Author:CarterPublisher:McGraw Hill
 College Algebra (MindTap Course List)AlgebraISBN:9781305652231Author:R. David Gustafson, Jeff HughesPublisher:Cengage Learning
 Big Ideas Math A Bridge To Success Algebra 1: Stu...AlgebraISBN:9781680331141Author:HOUGHTON MIFFLIN HARCOURTPublisher:Houghton Mifflin Harcourt
 Functions and Change: A Modeling Approach to Coll...AlgebraISBN:9781337111348Author:Bruce Crauder, Benny Evans, Alan NoellPublisher:Cengage Learning
 Trigonometry (MindTap Course List)TrigonometryISBN:9781305652224Author:Charles P. McKeague, Mark D. TurnerPublisher:Cengage Learning
Holt Mcdougal Larson Pre-algebra: Student Edition...
Algebra
ISBN:9780547587776
Author:HOLT MCDOUGAL
Publisher:HOLT MCDOUGAL
Glencoe Algebra 1, Student Edition, 9780079039897...
Algebra
ISBN:9780079039897
Author:Carter
Publisher:McGraw Hill
College Algebra (MindTap Course List)
Algebra
ISBN:9781305652231
Author:R. David Gustafson, Jeff Hughes
Publisher:Cengage Learning
Big Ideas Math A Bridge To Success Algebra 1: Stu...
Algebra
ISBN:9781680331141
Author:HOUGHTON MIFFLIN HARCOURT
Publisher:Houghton Mifflin Harcourt
Functions and Change: A Modeling Approach to Coll...
Algebra
ISBN:9781337111348
Author:Bruce Crauder, Benny Evans, Alan Noell
Publisher:Cengage Learning
Trigonometry (MindTap Course List)
Trigonometry
ISBN:9781305652224
Author:Charles P. McKeague, Mark D. Turner
Publisher:Cengage Learning
The Shape of Data: Distributions: Crash Course Statistics #7; Author: CrashCourse;https://www.youtube.com/watch?v=bPFNxD3Yg6U;License: Standard YouTube License, CC-BY
Shape, Center, and Spread - Module 20.2 (Part 1); Author: Mrmathblog;https://www.youtube.com/watch?v=COaid7O_Gag;License: Standard YouTube License, CC-BY
Shape, Center and Spread; Author: Emily Murdock;https://www.youtube.com/watch?v=_YyW0DSCzpM;License: Standard Youtube License