
Concept explainers
Videos
a.
To draw : a
a.
Explanation of Solution
Given information :
the set of data
figure : Now plot the each point in a coordinate plane as shown in the figure.
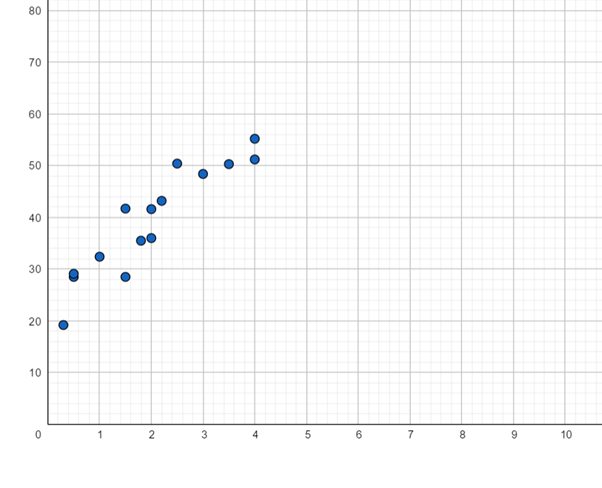
Interpretation: from the figure it can be observed that the data appear somewhat linear.
b.
To state : that the relationship between x and y appear to be approximately linear.
b.
Answer to Problem 5E
Yes, the data appear somewhat linear.
Explanation of Solution
Given information :
the set of data
from the data and its scatter plot it can be observed that the data appear somewhat linear, more experience, x , corresponds to higher sales y.
Chapter 1 Solutions
EP PRECALC.GRAPHING APPR.-WEBASSIGN-1YR


 Calculus: Early TranscendentalsCalculusISBN:9781285741550Author:James StewartPublisher:Cengage Learning
 Thomas' Calculus (14th Edition)CalculusISBN:9780134438986Author:Joel R. Hass, Christopher E. Heil, Maurice D. WeirPublisher:PEARSON
 Calculus: Early Transcendentals (3rd Edition)CalculusISBN:9780134763644Author:William L. Briggs, Lyle Cochran, Bernard Gillett, Eric SchulzPublisher:PEARSON
 Calculus: Early TranscendentalsCalculusISBN:9781319050740Author:Jon Rogawski, Colin Adams, Robert FranzosaPublisher:W. H. Freeman
 Calculus: Early Transcendental FunctionsCalculusISBN:9781337552516Author:Ron Larson, Bruce H. EdwardsPublisher:Cengage Learning