Concept explainers
(a)
To Graph: The
(a)
Explanation of Solution
Given Information:
Table of entrance exam score
| Exam score, x | Grade point y |
| 75 | 2.4 |
| 82 | 3.0 |
| 90 | 3.6 |
| 65 | 2.0 |
| 70 | 2.1 |
| 88 | 3.5 |
| 93 | 3.9 |
| 69 | 2.0 |
| 80 | 2.8 |
| 85 | 3.3 |
Graph:
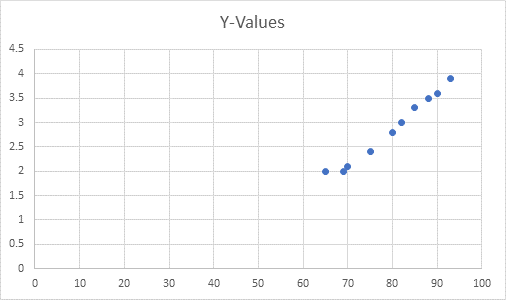
Scatter plot for the data:

(b)
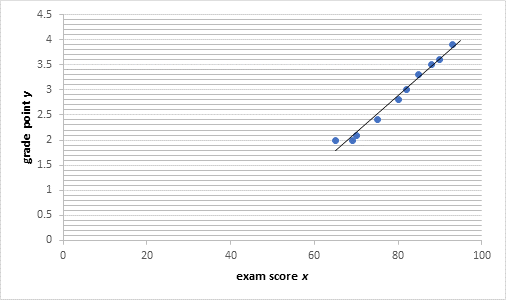
To find: Linear regression of scatter plot for given data.
(b)
Answer to Problem 108CR
The linear regression of the graph is
Explanation of Solution
Given Information:
Table of entrance exam score x and grade point average y
Formula used:
Slope intercept form:
Calculation:
The linear regression of the graph:
For value of C
Put (69, 2) in the equation, we get
Thus, the linear regression is
And
(c)
To calculate: The grade average point for a student with an entrance exam score of 95.
(c)
Answer to Problem 108CR
The grade average point for a student with an entrance exam score of 95 is 4.05.
Explanation of Solution
Given Information:
Table of entrance exam score x and grade point average y
Formula used:
Slope intercept form:
Calculation:

The grade average point for a student with an entrance exam score of 95 is:
Thus, the grade average point for a student with an entrance exam score of 95 is:4.05
Chapter 1 Solutions
EP PRECALC.GRAPHING APPR.-WEBASSIGN-1YR
 Calculus: Early TranscendentalsCalculusISBN:9781285741550Author:James StewartPublisher:Cengage Learning
 Thomas' Calculus (14th Edition)CalculusISBN:9780134438986Author:Joel R. Hass, Christopher E. Heil, Maurice D. WeirPublisher:PEARSON
 Calculus: Early Transcendentals (3rd Edition)CalculusISBN:9780134763644Author:William L. Briggs, Lyle Cochran, Bernard Gillett, Eric SchulzPublisher:PEARSON
 Calculus: Early TranscendentalsCalculusISBN:9781319050740Author:Jon Rogawski, Colin Adams, Robert FranzosaPublisher:W. H. Freeman
 Calculus: Early Transcendental FunctionsCalculusISBN:9781337552516Author:Ron Larson, Bruce H. EdwardsPublisher:Cengage Learning


