
Concept explainers
Videos
(a)
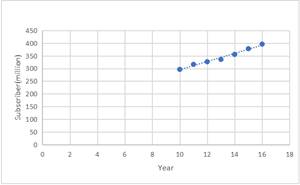
To graph: The data given in the table.
(a)
Explanation of Solution
Given data:
Table of year v/s subscriber
Graph:
Graph for the given table:
| Year | Subscribers, S (in millions) |
| 2010 | 296.3 |
| 2011 | 316.0 |
| 2012 | 326.5 |
| 2013 | 335.7 |
| 2014 | 355.4 |
| 2015 | 377.9 |
| 2016 | 395.9 |
Interpretation:
Subscribers are increasing every year.
(b)
To calculate: Linear regression of model.
(b)
Answer to Problem 20E
Linear regression of model is
Explanation of Solution
Given data:
Table of year v/s subscriber
Formula used:
Slope intercept form:
Calculation:
Linear regression of the model:
Conclusion:
Linear regression of model is
(c)
To explain: model is a good fit.
(c)
Answer to Problem 20E
Yes, it is a good fit.
Explanation of Solution
Given data:
Table of year v/s subscriber
Calculation:
Yes, this is a good fit because line of fit is having value nearly to approximately all original values.
Conclusion:
Yes it is a good fit.
(d)
To calculate: Subscriber in 2022.
(d)
Answer to Problem 20E
Subscriber for 2022 will be 495.5millions
Explanation of Solution
Given data:
Table of year v/s subscriber
Calculation:
Subscriber for 2022 will be:
It is a reasonable answer because as the graph is increasing with year.
Conclusion:
Subscriber for 2022 will be 495.5 millions
Chapter 1 Solutions
EP PRECALC.GRAPHING APPR.-WEBASSIGN-1YR


 Calculus: Early TranscendentalsCalculusISBN:9781285741550Author:James StewartPublisher:Cengage Learning
 Thomas' Calculus (14th Edition)CalculusISBN:9780134438986Author:Joel R. Hass, Christopher E. Heil, Maurice D. WeirPublisher:PEARSON
 Calculus: Early Transcendentals (3rd Edition)CalculusISBN:9780134763644Author:William L. Briggs, Lyle Cochran, Bernard Gillett, Eric SchulzPublisher:PEARSON
 Calculus: Early TranscendentalsCalculusISBN:9781319050740Author:Jon Rogawski, Colin Adams, Robert FranzosaPublisher:W. H. Freeman
 Calculus: Early Transcendental FunctionsCalculusISBN:9781337552516Author:Ron Larson, Bruce H. EdwardsPublisher:Cengage Learning