
Concept explainers
Videos
(a)
To find:The function that represent the situation of the given equation.
(a)
Answer to Problem 69E
The function that represent the situation of the given equation is
Explanation of Solution
Given information:
The given equationis
The height is
The initial velocity is
Calculation:
Using the position
The function is.
Therefore, the function that represent the situation of the given equation is
(b)
To graph: For the given function.
(b)
Explanation of Solution
Given information:
The given function is
Graph:
The graph for the given function is shown in figure (1).
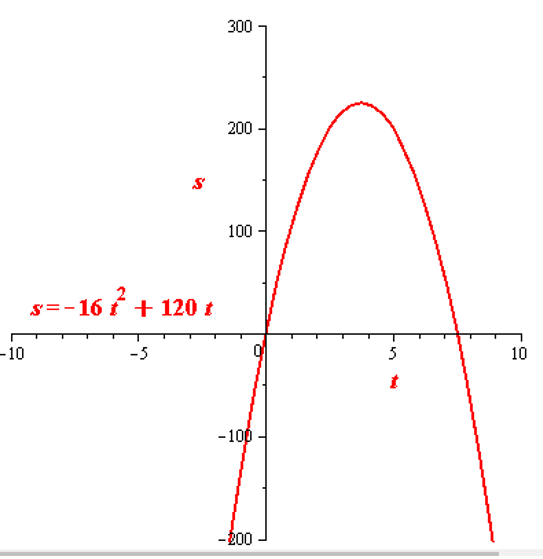
Figure (1)
Interpretation: Graph for the function
(c)
To find: The average rate of change of the function from
(c)
Answer to Problem 69E
The average rate of change of the function from
Explanation of Solution
Given information:
The given equation is
The values are
Calculation:
Average rate of change of the function from
Calculate the values at
Calculate average rate of change of the function from
Therefore, the average rate of change of the function from
(d)
To find: The behavior of slope of the secant line through
(d)
Answer to Problem 69E
The slope of the secant line through
Explanation of Solution
Given information:
The given equation is
The values are
Calculation:
The average rate of change between any two points
Therefore, the slope of the secant line through
(e)
To find: The slope of the secant line through
(e)
Answer to Problem 69E
The slope of the secant line through
Explanation of Solution
Given information:
The given equation is
The values are
Calculation:
Using the above value.
The equation of secant line is.
Therefore, the slope of the secant line through
(f)
To graph: For the secant line.
(f)
Explanation of Solution
Given information:
The secant line is
Graph:
The graph for the secant line is shown in figure (1).
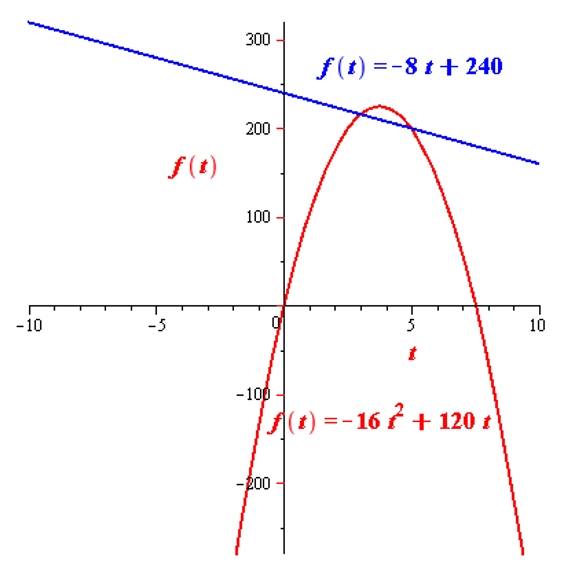
Figure (1)
Interpretation: Graph for the secant line
Chapter 1 Solutions
EBK PRECALCULUS W/LIMITS


- A 20 foot ladder rests on level ground; its head (top) is against a vertical wall. The bottom of the ladder begins by being 12 feet from the wall but begins moving away at the rate of 0.1 feet per second. At what rate is the top of the ladder slipping down the wall? You may use a calculator.arrow_forwardExplain the focus and reasons for establishment of 12.4.1(root test) and 12.4.2(ratio test)arrow_forwarduse Integration by Parts to derive 12.6.1arrow_forward
- Explain the relationship between 12.3.6, (case A of 12.3.6) and 12.3.7arrow_forwardExplain the key points and reasons for the establishment of 12.3.2(integral Test)arrow_forwardUse 12.4.2 to determine whether the infinite series on the right side of equation 12.6.5, 12.6.6 and 12.6.7 converges for every real number x.arrow_forward
- use Corollary 12.6.2 and 12.6.3 to derive 12.6.4,12.6.5, 12.6.6 and 12.6.7arrow_forwardExplain the focus and reasons for establishment of 12.5.1(lim(n->infinite) and sigma of k=0 to n)arrow_forwardExplain the focus and reasons for establishment of 12.5.3 about alternating series. and explain the reason why (sigma k=1 to infinite)(-1)k+1/k = 1/1 - 1/2 + 1/3 - 1/4 + .... converges.arrow_forward
 Calculus: Early TranscendentalsCalculusISBN:9781285741550Author:James StewartPublisher:Cengage Learning
 Thomas' Calculus (14th Edition)CalculusISBN:9780134438986Author:Joel R. Hass, Christopher E. Heil, Maurice D. WeirPublisher:PEARSON
 Calculus: Early Transcendentals (3rd Edition)CalculusISBN:9780134763644Author:William L. Briggs, Lyle Cochran, Bernard Gillett, Eric SchulzPublisher:PEARSON
 Calculus: Early TranscendentalsCalculusISBN:9781319050740Author:Jon Rogawski, Colin Adams, Robert FranzosaPublisher:W. H. Freeman
 Calculus: Early Transcendental FunctionsCalculusISBN:9781337552516Author:Ron Larson, Bruce H. EdwardsPublisher:Cengage Learning