Concept explainers
(a)
The
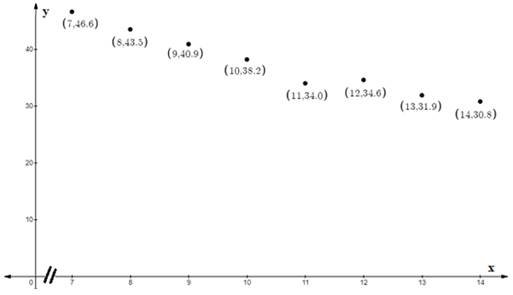
(a)
Answer to Problem 95RE
The graph is decreasing continuously on the positive axis.
Explanation of Solution
Given information:
The ordered pairs give the amount B in millions of kilograms of beef produced on private farms each year from 2007 through 2014.
Formula used:
The x-axis represents year and the y-axis represent the t value.
Calculation:
Let

Conclusion:
The graph is decreasing continuously on the positive axis.
(b)
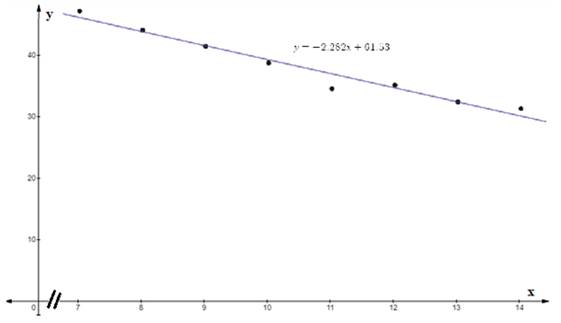
The equation of the least square regression line.
(b)
Answer to Problem 95RE
It is the straight line that decreases continuously on the positive axis.
Explanation of Solution
Given information:
The ordered pairs give the amount B in millions of kilograms of beef produced on private farms each year from 2007 through 2014.
Formula used:
The x-axis represents year and the y-axis represent the t value.
Calculation:
Use the regression feature of a graphing utility, the equation of the least-squares regression line is
The graph:

Conclusion:
It is the straight line that decreases continuously on the positive axis.
Chapter 1 Solutions
EBK PRECALCULUS W/LIMITS
- Pls help ASAParrow_forward9. a) Determie values of a and b so that the function is continuous. ax - 2b f(x) 2 x≤-2 -2x+a, x ≥2 \-ax² - bx + 1, −2 < x < 2) 9b) Consider f(x): = 2x²+x-3 x-b and determine all the values of b such that f(x) does not have a vertical asymptote. Show work.arrow_forwardPls help ASAParrow_forward
- 3. True False. If false create functions that prove it is false. Note: f(x) = g(x). a) If_lim ƒ(x) = ∞ and_lim g(x) = ∞,then_lim [ƒ(x) − g(x)] = 0 x→ 0+ x→0+ x→0+ b) If h(x) and g(x) are continuous at x = c, and if h(c) > 0 and g(c) = 0, then h(x) lim. will = x→c g(x) c) If lim f(x) = 0 and lim g(x) = 0 then lim f(x) does not exist. x-a x-a x→a g(x)arrow_forwardPls help ASAParrow_forward15. a) Consider f(x) = x-1 3x+2 and use the difference quotient to determine the simplified expression in terms of x, for the slope of any tangent to y = f(x). Also, determine the slope at x = 2. 15 b) Determine the equation of the tangent to f(x) at x = 2. Final answer in Standard Form Ax + By + C = 0, A ≥ 0, with no fractions or decimals.arrow_forward
 Calculus: Early TranscendentalsCalculusISBN:9781285741550Author:James StewartPublisher:Cengage Learning
 Thomas' Calculus (14th Edition)CalculusISBN:9780134438986Author:Joel R. Hass, Christopher E. Heil, Maurice D. WeirPublisher:PEARSON
 Calculus: Early Transcendentals (3rd Edition)CalculusISBN:9780134763644Author:William L. Briggs, Lyle Cochran, Bernard Gillett, Eric SchulzPublisher:PEARSON
 Calculus: Early TranscendentalsCalculusISBN:9781319050740Author:Jon Rogawski, Colin Adams, Robert FranzosaPublisher:W. H. Freeman
 Calculus: Early Transcendental FunctionsCalculusISBN:9781337552516Author:Ron Larson, Bruce H. EdwardsPublisher:Cengage Learning


