
Concept explainers
Videos
a .
To sketch: the
a .
Answer to Problem 46E
Explanation of Solution
Given:
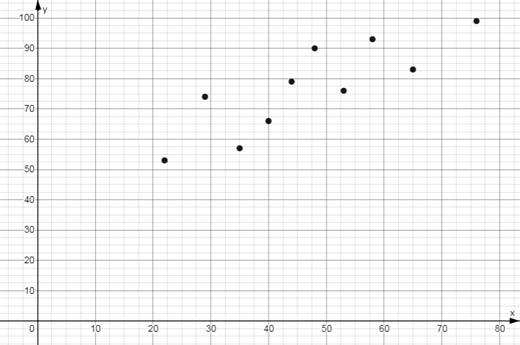
The table below shows the mathematics entrance test scores x and the final exam score y .
| x | 22 | 29 | 35 | 40 | 44 | 48 | 53 | 58 | 65 | 76 |
| y | 53 | 74 | 57 | 66 | 79 | 90 | 76 | 93 | 83 | 99 |
To sketch the scatter plot of the given data, represent each pair of values of given data as an ordered pair
So, as ordered pairs, the given data is written as:
Now to plot the point
Similarly, plot the rest of the points.
The scatter plot of the given data is as shown below:

b.
To find:the entrance test score of a student with final exam score in the 80s.
b.
Answer to Problem 46E
Explanation of Solution
From part (a) the scatter plot of the mathematics entrance test scores x and the final exam score y is as given below:

Now, it is given that the final exam score of the student is in 80s.
And on observing the scatter plot above it can be noted that the point for which y -coordinate is in 80’s have x -coordinate 65.
So, taking that as the required x -coordinate, it can be said the entrance exam score of the student is around 65.
c.
To find:if higher entrance exam score imply higher final exam score.
c.
Answer to Problem 46E
No
Explanation of Solution
No, higher entrance exam score does not imply higher final exam score. It can be easily observed by looking at the given data.
Observe the data of with scores
Chapter 1 Solutions
EBK PRECALCULUS W/LIMITS


- Find the indefinite integral. (Remember the constant of integration.) √tan(8x) tan(8x) sec²(8x) dxarrow_forwardFind the indefinite integral by making a change of variables. (Remember the constant of integration.) √(x+4) 4)√6-x dxarrow_forwarda -> f(x) = f(x) = [x] show that whether f is continuous function or not(by using theorem) Muslim_mathsarrow_forward
- Use Green's Theorem to evaluate F. dr, where F = (√+4y, 2x + √√) and C consists of the arc of the curve y = 4x - x² from (0,0) to (4,0) and the line segment from (4,0) to (0,0).arrow_forwardEvaluate F. dr where F(x, y, z) = (2yz cos(xyz), 2xzcos(xyz), 2xy cos(xyz)) and C is the line π 1 1 segment starting at the point (8, ' and ending at the point (3, 2 3'6arrow_forwardCan you help me find the result of an integral + a 炉[メをメ +炉なarrow_forward
- I need help making sure that I explain this part accutartly.arrow_forwardPlease help me with this question as I want to know how can I perform the partial fraction decompostion on this alebgric equation to find the time-domain of y(t)arrow_forwardPlease help me with this question as I want to know how can I perform the partial fraction on this alebgric equation to find the time-domain of y(t)arrow_forward
 Calculus: Early TranscendentalsCalculusISBN:9781285741550Author:James StewartPublisher:Cengage Learning
 Thomas' Calculus (14th Edition)CalculusISBN:9780134438986Author:Joel R. Hass, Christopher E. Heil, Maurice D. WeirPublisher:PEARSON
 Calculus: Early Transcendentals (3rd Edition)CalculusISBN:9780134763644Author:William L. Briggs, Lyle Cochran, Bernard Gillett, Eric SchulzPublisher:PEARSON
 Calculus: Early TranscendentalsCalculusISBN:9781319050740Author:Jon Rogawski, Colin Adams, Robert FranzosaPublisher:W. H. Freeman
 Calculus: Early Transcendental FunctionsCalculusISBN:9781337552516Author:Ron Larson, Bruce H. EdwardsPublisher:Cengage Learning