
Concept explainers
Videos
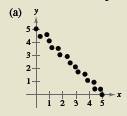
(a)
The linear model approximation.
(a)
Answer to Problem 78E
There is high linear co- relation.
Explanation of Solution
Given information:
The linear model approximation is shown below,
Formula used:
The x −axis represent the horizontal axis and the y-axis represent the vertical axis.
Calculation:
In the following graph, the value of y decreases with the increase in the value of x
It can be seen from graph that data follows a linear model well. Hence there is high linear co- relation.
Conclusion:
There is high linear co- relation.
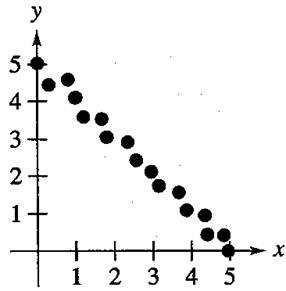
(b)
The linear model approximation.
(b)
Answer to Problem 78E
The data represents a parabola shape, hence there is no co-relation.
Explanation of Solution
Given information:
The linear model approximation is shown below,
Formula used:
The x −axis represent the horizontal axis and the y-axis represent the vertical axis.
Calculation:
Consider the following graph
In the given graph data represents a parabola shape, hence there is no co-relation.
Conclusion:
The data represents a parabola shape, hence there is no co-relation.
(c)
The linear model approximation.
(c)
Answer to Problem 78E
There is moderate co-relation.
Explanation of Solution
Given information:
The linear model approximation is shown below,

Formula used:
The x −axis represent the horizontal axis and the y-axis represent the vertical axis.
Calculation:
Consider the following graph
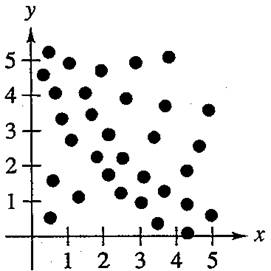
In the above graph value of y decreases with increase in value of x
The data follows a linear model but at some point there is deviation from linear model, hence there is moderate co-relation.
Conclusion:
There is moderate co-relation.
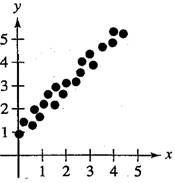
(d)
The linear model approximation.
(d)
Answer to Problem 78E
There is high linear co- relation.
Explanation of Solution
Given information:
The linear model approximation is shown below,
Formula used:
The x −axis represent the horizontal axis and the y-axis represent the vertical axis.
Calculation:
Consider the following graph

In the above graph value of y increases with increase in value of x
It can be seen from graph that data follows a linear model well. Hence there is high linear co- relation.
Conclusion:
There is high linear co- relation.
Chapter 1 Solutions
EBK PRECALCULUS W/LIMITS


- please do Q3arrow_forwardUse the properties of logarithms, given that In(2) = 0.6931 and In(3) = 1.0986, to approximate the logarithm. Use a calculator to confirm your approximations. (Round your answers to four decimal places.) (a) In(0.75) (b) In(24) (c) In(18) 1 (d) In ≈ 2 72arrow_forwardFind the indefinite integral. (Remember the constant of integration.) √tan(8x) tan(8x) sec²(8x) dxarrow_forward
- Find the indefinite integral by making a change of variables. (Remember the constant of integration.) √(x+4) 4)√6-x dxarrow_forwarda -> f(x) = f(x) = [x] show that whether f is continuous function or not(by using theorem) Muslim_mathsarrow_forwardUse Green's Theorem to evaluate F. dr, where F = (√+4y, 2x + √√) and C consists of the arc of the curve y = 4x - x² from (0,0) to (4,0) and the line segment from (4,0) to (0,0).arrow_forward
- Evaluate F. dr where F(x, y, z) = (2yz cos(xyz), 2xzcos(xyz), 2xy cos(xyz)) and C is the line π 1 1 segment starting at the point (8, ' and ending at the point (3, 2 3'6arrow_forwardCan you help me find the result of an integral + a 炉[メをメ +炉なarrow_forward2 a Can you help me find the result of an integral a 아 x² dxarrow_forward
 Calculus: Early TranscendentalsCalculusISBN:9781285741550Author:James StewartPublisher:Cengage Learning
 Thomas' Calculus (14th Edition)CalculusISBN:9780134438986Author:Joel R. Hass, Christopher E. Heil, Maurice D. WeirPublisher:PEARSON
 Calculus: Early Transcendentals (3rd Edition)CalculusISBN:9780134763644Author:William L. Briggs, Lyle Cochran, Bernard Gillett, Eric SchulzPublisher:PEARSON
 Calculus: Early TranscendentalsCalculusISBN:9781319050740Author:Jon Rogawski, Colin Adams, Robert FranzosaPublisher:W. H. Freeman
 Calculus: Early Transcendental FunctionsCalculusISBN:9781337552516Author:Ron Larson, Bruce H. EdwardsPublisher:Cengage Learning