
Concept explainers
Videos
(a)
The decade showing the greatest increase in the minimum wage.
(a)
Answer to Problem 45E
The graph the decade of
Explanation of Solution
Given information:
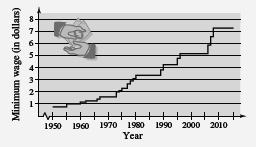
Use the graph of minimum wages in the United States from 1950 through 2015.

Calculation:
Use the graph of minimum wages in the United States from 1950 through 2015 and find the decade of the greatest increase, the percentage increases in the minimum wage.
With the help of the graph the decade of
Conclusion:
The graph the decade of
(b)
That the percent increases in the minimum wage from 1985 to 2000 and from 2000 to 2015.
(b)
Answer to Problem 45E
From 1985 to 2000 the percent increase in the minimum wage is 57.7%
From 2000 to 2015 the percent increase in the minimum wage is 41.5%
Explanation of Solution
Given information:
Use the graph of minimum wages in the United States from 1950 through 2015.

Calculation:
With the help of the graph the wage is $3.25 in 1985, the wage is $5.125 in 2000 and the wage is $7.25 in 2015.
From 1985 to 2000 the percent increase in the minimum wage will be
From 2000 to 2015 the percent increase in the minimum wage will be
Conclusion:
From 1985 to 2000 the percent increase in the minimum wage is 57.7%
From 2000 to 2015 the percent increase in the minimum wage is 41.5%
(c)
The percent increase from 2000 to 2015 to predict the minimum wage in 2030.
(c)
Answer to Problem 45E
The minimum wage is $10.26 in 2030.
Explanation of Solution
Given information:
Use the graph of minimum wages in the United States from 1950 through 2015.
Calculation:
Use the percent increase from 2000 to 2015 and the minimum wage in 2030 will be
Therefore, the minimum wage is $10.26 in 2030.
Conclusion:
The minimum wage is $10.26 in 2030.
(a)
The prediction is reasonable.
(a)
Answer to Problem 45E
The prediction is not reasonable.
Explanation of Solution
Given information:
Use the graph of minimum wages in the United States from 1950 through 2015.

Calculation:
The prediction is not reasonable.
No, the prediction is too high because it is likely that the percent increased.
Conclusion:
The prediction is too high because it is likely that the percent increased.
Chapter 1 Solutions
EBK PRECALCULUS W/LIMITS


- I need help in ensuring that I explain it propleryy in the simplifest way as possiblearrow_forwardI need help making sure that I explain this part accutartly.arrow_forwardPlease help me with this question as I want to know how can I perform the partial fraction decompostion on this alebgric equation to find the time-domain of y(t)arrow_forward
- Please help me with this question as I want to know how can I perform the partial fraction on this alebgric equation to find the time-domain of y(t)arrow_forwardEvaluate F³ - dr where ♬ = (4z, -4y, x), and C' is given by (t) = (sin(t), t, cos(t)), 0≤t≤ñ .arrow_forwardMid-Term Review Find the formula for (f + g)(x). f(x) = x² - 10x + 25 and g(x) = x² - 10x + 24 (f + g) (x) = [ 2 ]x² X + DELL Skip Sarrow_forward
- Calculus III May I please have some elaborations on Example 2 part a? Thank you.arrow_forward1. A bicyclist is riding their bike along the Chicago Lakefront Trail. The velocity (in feet per second) of the bicyclist is recorded below. Use (a) Simpson's Rule, and (b) the Trapezoidal Rule to estimate the total distance the bicyclist traveled during the 8-second period. t 0 2 4 6 8 V 10 15 12 10 16 2. Find the midpoint rule approximation for (a) n = 4 +5 x²dx using n subintervals. 1° 2 (b) n = 8 36 32 28 36 32 28 24 24 20 20 16 16 12 8- 4 1 2 3 4 5 6 12 8 4 1 2 3 4 5 6arrow_forward= 5 37 A 4 8 0.5 06 9arrow_forward
- Consider the following system of equations, Ax=b : x+2y+3z - w = 2 2x4z2w = 3 -x+6y+17z7w = 0 -9x-2y+13z7w = -14 a. Find the solution to the system. Write it as a parametric equation. You can use a computer to do the row reduction. b. What is a geometric description of the solution? Explain how you know. c. Write the solution in vector form? d. What is the solution to the homogeneous system, Ax=0?arrow_forward2. Find a matrix A with the following qualities a. A is 3 x 3. b. The matrix A is not lower triangular and is not upper triangular. c. At least one value in each row is not a 1, 2,-1, -2, or 0 d. A is invertible.arrow_forwardFind the exact area inside r=2sin(2\theta ) and outside r=\sqrt(3)arrow_forward
 Calculus: Early TranscendentalsCalculusISBN:9781285741550Author:James StewartPublisher:Cengage Learning
 Thomas' Calculus (14th Edition)CalculusISBN:9780134438986Author:Joel R. Hass, Christopher E. Heil, Maurice D. WeirPublisher:PEARSON
 Calculus: Early Transcendentals (3rd Edition)CalculusISBN:9780134763644Author:William L. Briggs, Lyle Cochran, Bernard Gillett, Eric SchulzPublisher:PEARSON
 Calculus: Early TranscendentalsCalculusISBN:9781319050740Author:Jon Rogawski, Colin Adams, Robert FranzosaPublisher:W. H. Freeman
 Calculus: Early Transcendental FunctionsCalculusISBN:9781337552516Author:Ron Larson, Bruce H. EdwardsPublisher:Cengage Learning