
Concept explainers
Videos
a.
Explain the maximum and minimum points mean in the context of the situation.
a.
Answer to Problem 40PPS
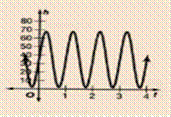
The maximum point means that the rope is the highest at
The minimum point means that the rope is the lowest at
Explanation of Solution
Given:
It is given in the question that the graph shows the approximates the height of a jump rope h in inches as a function of time t in seconds. A Maximum point on the graph is

Concept Used:
In this, use the concept of study the graph and describe the maximum and minimum points.
Calculation:
Since, from the graph
The x − coordinate represents the time.
The y − coordinate represents the height.
The maximum point means that the rope is the highest at
The minimum point means that the rope is the lowest at
Conclusion:
The maximum point means that the rope is the highest at
The minimum point means that the rope is the lowest at
b.
Calculate the equation for the midline, the amplitude and the period of the function.
b.
Answer to Problem 40PPS
The midline, amplitude and the period are
Explanation of Solution
Given:
It is given in the question that the graph shows the approximates the height of a jump rope h in inches as a function of time t in seconds. A Maximum point on the graph is
Concept Used:
In this, use the concept of general equation of sine
Calculation: Let the equation be
Firstly find the midline, d :
Now, the amplitude is the difference between the midline and maximum value:
Since, it takes
Now, it is known that the period is
Let’s find b:
Conclusion:
The midline, amplitude and the period are
c.
Find the equation for the function.
c.
Answer to Problem 40PPS
The equation for the function is
Explanation of Solution
Given: It is given in the question that amplitude, period and midline are
Concept Used:
In this, use the general equation of the sine function
Calculation: Let the function be
Now,
Put the above value in the equation,
The equation is
Conclusion:
The equation is
Chapter 13 Solutions
Algebra 2
Additional Math Textbook Solutions
Elementary Statistics: Picturing the World (7th Edition)
Calculus: Early Transcendentals (2nd Edition)
Introductory Statistics
University Calculus: Early Transcendentals (4th Edition)
Algebra and Trigonometry (6th Edition)
A First Course in Probability (10th Edition)


- Find the Laplace Transform of the function to express it in frequency domain form.arrow_forwardPlease draw a graph that represents the system of equations f(x) = x2 + 2x + 2 and g(x) = –x2 + 2x + 4?arrow_forwardGiven the following system of equations and its graph below, what can be determined about the slopes and y-intercepts of the system of equations? 7 y 6 5 4 3 2 -6-5-4-3-2-1 1+ -2 1 2 3 4 5 6 x + 2y = 8 2x + 4y = 12 The slopes are different, and the y-intercepts are different. The slopes are different, and the y-intercepts are the same. The slopes are the same, and the y-intercepts are different. O The slopes are the same, and the y-intercepts are the same.arrow_forward
- Choose the function to match the graph. -2- 0 -7 -8 -9 --10- |--11- -12- f(x) = log x + 5 f(x) = log x - 5 f(x) = log (x+5) f(x) = log (x-5) 9 10 11 12 13 14arrow_forwardWhich of the following represents the graph of f(x)=3x-2? 7 6 5 4 ++ + + -7-6-5-4-3-2-1 1 2 3 4 5 6 7 -2 3 -5 6 -7 96 7 5 4 O++ -7-6-5-4-3-2-1 -2 -3 -4 -5 -7 765 432 -7-6-5-4-3-2-1 -2 ++ -3 -4 -5 -6 2 3 4 5 6 7 7 6 2 345 67 -7-6-5-4-3-2-1 2 3 4 5 67 4 -5arrow_forward13) Let U = {j, k, l, m, n, o, p} be the universal set. Let V = {m, o,p), W = {l,o, k}, and X = {j,k). List the elements of the following sets and the cardinal number of each set. a) W° and n(W) b) (VUW) and n((V U W)') c) VUWUX and n(V U W UX) d) vnWnX and n(V WnX)arrow_forward
- 9) Use the Venn Diagram given below to determine the number elements in each of the following sets. a) n(A). b) n(A° UBC). U B oh a k gy ท W z r e t ་ Carrow_forward10) Find n(K) given that n(T) = 7,n(KT) = 5,n(KUT) = 13.arrow_forward7) Use the Venn Diagram below to determine the sets A, B, and U. A = B = U = Blue Orange white Yellow Black Pink Purple green Grey brown Uarrow_forward
 Algebra and Trigonometry (6th Edition)AlgebraISBN:9780134463216Author:Robert F. BlitzerPublisher:PEARSON
 Contemporary Abstract AlgebraAlgebraISBN:9781305657960Author:Joseph GallianPublisher:Cengage Learning
 Linear Algebra: A Modern IntroductionAlgebraISBN:9781285463247Author:David PoolePublisher:Cengage Learning
 Algebra And Trigonometry (11th Edition)AlgebraISBN:9780135163078Author:Michael SullivanPublisher:PEARSON
 Introduction to Linear Algebra, Fifth EditionAlgebraISBN:9780980232776Author:Gilbert StrangPublisher:Wellesley-Cambridge Press
 College Algebra (Collegiate Math)AlgebraISBN:9780077836344Author:Julie Miller, Donna GerkenPublisher:McGraw-Hill Education