
Statistics for Business and Economics (13th Edition)
13th Edition
ISBN: 9780134506593
Author: James T. McClave, P. George Benson, Terry Sincich
Publisher: PEARSON
expand_more
expand_more
format_list_bulleted
Concept explainers
Videos
Textbook Question
Chapter 9.3, Problem 9.41ACB
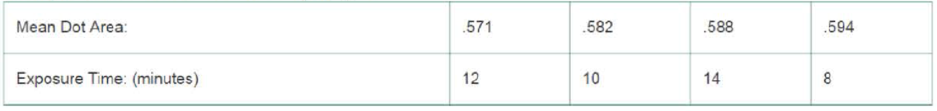
Evaluation of flexography printing plates. Refer to the Journal of Graphic Engineering and Design (Vol. 3, 2012) study of the quality of flexography printing, Exercise 9.24 (p. 520). Recall that four different exposure times were studied—8,10, 12, and 14 minutes—and that the measure of print quality used was dot area (hundreds of dots per square millimeter). Tukey’s multiple comparisons procedure (at an experimentwise error rate of .05) was used to rank the mean dot areas of the four exposure times. The results are summarized below. Which exposure time yields the highest mean dot area? Lowest? (14,8); 12
Expert Solution & Answer
Want to see the full answer?
Check out a sample textbook solution
Students have asked these similar questions
4.96 The breaking strengths for 1-foot-square samples of a particular synthetic fabric are approximately normally distributed with a mean of 2,250 pounds per square inch (psi) and a standard deviation of 10.2 psi. Find the probability of selecting a 1-foot-square sample of material at random that on testing would have a breaking strength in excess of 2,265 psi.4.97 Refer to Exercise 4.96. Suppose that a new synthetic fabric has been developed that may have a different mean breaking strength. A random sample of 15 1-foot sections is obtained, and each section is tested for breaking strength. If we assume that the population standard deviation for the new fabric is identical to that for the old fabric, describe the sampling distribution forybased on random samples of 15 1-foot sections of new fabric
Une Entreprise œuvrant dans le domaine du multividéo donne l'opportunité à ses
programmeurs-analystes d'évaluer la performance des cadres supérieurs.
Voici les résultats obtenues (sur une échelle de 10 à 50) où 50 représentent une
excellente performance. 10 programmeurs furent sélectionnés au hazard pour
évaluer deux cadres. Un rapport Excel est également fourni.
Programmeurs
Cadre A Cadre B
1
34
36
2
32
34
3
18
19
33
38
19
21
21
23
7
35
34
8
20
20
9
34
34
10
36
34
Test d'égalité des espérances: observations pairées
A television news channel samples 25 gas stations from its local area and uses the results to estimate the average gas price for the state. What’s wrong with its margin of error?
Chapter 9 Solutions
Statistics for Business and Economics (13th Edition)
Ch. 9.1 - What are the treatments for a designed experiment...Ch. 9.1 - What are the treatments for a designed experiment...Ch. 9.1 - What is the difference between an observational...Ch. 9.1 - What are the experimental units on which each of...Ch. 9.1 - Identifying the type of experiment. Brief...Ch. 9.1 - Drafting NFL quarterbacks. Refer to the Journal of...Ch. 9.1 - Corporate sustainability and firm characteristics....Ch. 9.1 - Prob. 9.8ACBCh. 9.1 - Can money spent on gifts buy love? Refer to the...Ch. 9.1 - Value perceptions of consumers. Refer to the...
Ch. 9.1 - Value perceptions of consumers (contd). Refer to...Ch. 9.1 - Reducing stress in livestock transported to...Ch. 9.1 - Mixed gender decision-making groups. In business,...Ch. 9.1 - Testing a new pain-reliever tablet. Paracetamol is...Ch. 9.2 - Use Tables V, VI, VII, and VIII in Appendix D to...Ch. 9.2 - Find the following probabilities: a. P (F 3.48)...Ch. 9.2 - Consider dot plots 1 and 2 shown below. Assume...Ch. 9.2 - Refer to Exercise 9.17. Conduct a two-sample...Ch. 9.2 - Refer to Exercises 9.17 and 9.18. Complete the...Ch. 9.2 - A partially completed ANOVA table for a completely...Ch. 9.2 - The data in the next table resulted from an...Ch. 9.2 - Prob. 9.22ACBCh. 9.2 - Prob. 9.23ACBCh. 9.2 - Prob. 9.24ACBCh. 9.2 - Prob. 9.25ACBCh. 9.2 - Making high-stakes insurance decisions. The...Ch. 9.2 - Contingent valuation of homes in contaminated...Ch. 9.2 - Study of recall of TV commercials. Do TV shows...Ch. 9.2 - Do the media influence your attitude toward...Ch. 9.2 - Homework assistance for accounting students. Refer...Ch. 9.2 - Prob. 9.31ACICh. 9.2 - Is honey a cough remedy? Pediatric researchers...Ch. 9.2 - Prob. 9.33ACICh. 9.2 - Banning controversial sports team sponsors....Ch. 9.3 - Consider a completely randomized design with k...Ch. 9.3 - Prob. 9.36LMCh. 9.3 - Prob. 9.37LMCh. 9.3 - Prob. 9.38LMCh. 9.3 - Prob. 9.39LMCh. 9.3 - Prob. 9.40ACBCh. 9.3 - Evaluation of flexography printing plates. Refer...Ch. 9.3 - Guilt in decision making. The effect of guilt...Ch. 9.3 - Prob. 9.43ACBCh. 9.3 - Prob. 9.44ACBCh. 9.3 - Prob. 9.45ACICh. 9.3 - Study of recall of TV commercials. Refer to the...Ch. 9.3 - Prob. 9.47ACICh. 9.3 - Prob. 9.48ACICh. 9.3 - Prob. 9.49ACICh. 9.4 - A randomized block design yielded the following...Ch. 9.4 - Prob. 9.51LMCh. 9.4 - A randomized block design was used to compare the...Ch. 9.4 - Prob. 9.53LMCh. 9.4 - Prob. 9.54ACBCh. 9.4 - Peer mentor training at a firm. Peer mentoring...Ch. 9.4 - Prob. 9.56ACBCh. 9.4 - Interactive video games and physical fitness. Wii...Ch. 9.4 - Prob. 9.58ACBCh. 9.4 - A new method of evaluating health care research...Ch. 9.4 - Prob. 9.60ACICh. 9.4 - Prob. 9.61ACICh. 9.4 - Stress in cows prior to slaughter. What is the...Ch. 9.4 - Anticorrosive behavior of steel coated with epoxy....Ch. 9.5 - Suppose you conduct a 4 3 factorial experiment....Ch. 9.5 - Prob. 9.65LMCh. 9.5 - The partially complete ANOVA table given next is...Ch. 9.5 - Prob. 9.67LMCh. 9.5 - The next table gives data for a 2 2 factorial...Ch. 9.5 - Suppose a 3 3 factorial experiment is conducted...Ch. 9.5 - Dynamics of the buyer-seller relationship. An...Ch. 9.5 - Prob. 9.71ACBCh. 9.5 - Prob. 9.72ACBCh. 9.5 - Prob. 9.73ACBCh. 9.5 - Prob. 9.74ACBCh. 9.5 - Temptation in consumer choice. Are you willing to...Ch. 9.5 - Commercial eggs produced from different housing...Ch. 9.5 - Prob. 9.77ACICh. 9.5 - Eyewitnesses and mugshots. Criminologists...Ch. 9.5 - Impact of flavor name on consumer choice. Do...Ch. 9 - What is the difference between a one-way ANOVA and...Ch. 9 - Explain the difference between an experiment that...Ch. 9 - What are the treatments in a two-factor...Ch. 9 - Why does the experimentwise error rate of a...Ch. 9 - A completely randomized design is used to compare...Ch. 9 - An experiment employing a randomized block design...Ch. 9 - The following table shows a partially completed...Ch. 9 - Prob. 9.89ACBCh. 9 - Prob. 9.90ACBCh. 9 - Impact of paper color on exam scores. A study...Ch. 9 - Study of mutual fund performance. Mutual funds are...Ch. 9 - Study of mutual fund performance. Refer to...Ch. 9 - Prob. 9.94ACBCh. 9 - Prob. 9.95ACBCh. 9 - Prob. 9.96ACBCh. 9 - Bakers vs. brewers yeast. The Electronic Journal...Ch. 9 - A managerial decision problem. A direct-mail...Ch. 9 - Ethics of downsizing. A major strategic...Ch. 9 - Absentee rates at a jeans plant. A plant that...Ch. 9 - Effectiveness of sales closing techniques....Ch. 9 - Prob. 9.103ACICh. 9 - Prob. 9.104ACICh. 9 - Managers trust and job-related tension. Research...Ch. 9 - Testing the effectiveness of supermarket sales...Ch. 9 - Prob. 9.107ACICh. 9 - Prob. 9.108ACICh. 9 - Pollutants at a housing development. Polycyclic...Ch. 9 - Explain why both of the situations n Activity 8.1...
Knowledge Booster


Learn more about
Need a deep-dive on the concept behind this application? Look no further. Learn more about this topic, statistics and related others by exploring similar questions and additional content below.Similar questions
- You’re fed up with keeping Fido locked inside, so you conduct a mail survey to find out people’s opinions on the new dog barking ordinance in a certain city. Of the 10,000 people who receive surveys, 1,000 respond, and only 80 are in favor of it. You calculate the margin of error to be 1.2 percent. Explain why this reported margin of error is misleading.arrow_forwardYou find out that the dietary scale you use each day is off by a factor of 2 ounces (over — at least that’s what you say!). The margin of error for your scale was plus or minus 0.5 ounces before you found this out. What’s the margin of error now?arrow_forwardSuppose that Sue and Bill each make a confidence interval out of the same data set, but Sue wants a confidence level of 80 percent compared to Bill’s 90 percent. How do their margins of error compare?arrow_forward
- Suppose that you conduct a study twice, and the second time you use four times as many people as you did the first time. How does the change affect your margin of error? (Assume the other components remain constant.)arrow_forwardOut of a sample of 200 babysitters, 70 percent are girls, and 30 percent are guys. What’s the margin of error for the percentage of female babysitters? Assume 95 percent confidence.What’s the margin of error for the percentage of male babysitters? Assume 95 percent confidence.arrow_forwardYou sample 100 fish in Pond A at the fish hatchery and find that they average 5.5 inches with a standard deviation of 1 inch. Your sample of 100 fish from Pond B has the same mean, but the standard deviation is 2 inches. How do the margins of error compare? (Assume the confidence levels are the same.)arrow_forward
- A survey of 1,000 dental patients produces 450 people who floss their teeth adequately. What’s the margin of error for this result? Assume 90 percent confidence.arrow_forwardThe annual aggregate claim amount of an insurer follows a compound Poisson distribution with parameter 1,000. Individual claim amounts follow a Gamma distribution with shape parameter a = 750 and rate parameter λ = 0.25. 1. Generate 20,000 simulated aggregate claim values for the insurer, using a random number generator seed of 955.Display the first five simulated claim values in your answer script using the R function head(). 2. Plot the empirical density function of the simulated aggregate claim values from Question 1, setting the x-axis range from 2,600,000 to 3,300,000 and the y-axis range from 0 to 0.0000045. 3. Suggest a suitable distribution, including its parameters, that approximates the simulated aggregate claim values from Question 1. 4. Generate 20,000 values from your suggested distribution in Question 3 using a random number generator seed of 955. Use the R function head() to display the first five generated values in your answer script. 5. Plot the empirical density…arrow_forwardFind binomial probability if: x = 8, n = 10, p = 0.7 x= 3, n=5, p = 0.3 x = 4, n=7, p = 0.6 Quality Control: A factory produces light bulbs with a 2% defect rate. If a random sample of 20 bulbs is tested, what is the probability that exactly 2 bulbs are defective? (hint: p=2% or 0.02; x =2, n=20; use the same logic for the following problems) Marketing Campaign: A marketing company sends out 1,000 promotional emails. The probability of any email being opened is 0.15. What is the probability that exactly 150 emails will be opened? (hint: total emails or n=1000, x =150) Customer Satisfaction: A survey shows that 70% of customers are satisfied with a new product. Out of 10 randomly selected customers, what is the probability that at least 8 are satisfied? (hint: One of the keyword in this question is “at least 8”, it is not “exactly 8”, the correct formula for this should be = 1- (binom.dist(7, 10, 0.7, TRUE)). The part in the princess will give you the probability of seven and less than…arrow_forward
- please answer these questionsarrow_forwardSelon une économiste d’une société financière, les dépenses moyennes pour « meubles et appareils de maison » ont été moins importantes pour les ménages de la région de Montréal, que celles de la région de Québec. Un échantillon aléatoire de 14 ménages pour la région de Montréal et de 16 ménages pour la région Québec est tiré et donne les données suivantes, en ce qui a trait aux dépenses pour ce secteur d’activité économique. On suppose que les données de chaque population sont distribuées selon une loi normale. Nous sommes intéressé à connaitre si les variances des populations sont égales.a) Faites le test d’hypothèse sur deux variances approprié au seuil de signification de 1 %. Inclure les informations suivantes : i. Hypothèse / Identification des populationsii. Valeur(s) critique(s) de Fiii. Règle de décisioniv. Valeur du rapport Fv. Décision et conclusion b) A partir des résultats obtenus en a), est-ce que l’hypothèse d’égalité des variances pour cette…arrow_forwardAccording to an economist from a financial company, the average expenditures on "furniture and household appliances" have been lower for households in the Montreal area than those in the Quebec region. A random sample of 14 households from the Montreal region and 16 households from the Quebec region was taken, providing the following data regarding expenditures in this economic sector. It is assumed that the data from each population are distributed normally. We are interested in knowing if the variances of the populations are equal. a) Perform the appropriate hypothesis test on two variances at a significance level of 1%. Include the following information: i. Hypothesis / Identification of populations ii. Critical F-value(s) iii. Decision rule iv. F-ratio value v. Decision and conclusion b) Based on the results obtained in a), is the hypothesis of equal variances for this socio-economic characteristic measured in these two populations upheld? c) Based on the results obtained in a),…arrow_forward
arrow_back_ios
SEE MORE QUESTIONS
arrow_forward_ios
Recommended textbooks for you
 Glencoe Algebra 1, Student Edition, 9780079039897...AlgebraISBN:9780079039897Author:CarterPublisher:McGraw Hill
 Big Ideas Math A Bridge To Success Algebra 1: Stu...AlgebraISBN:9781680331141Author:HOUGHTON MIFFLIN HARCOURTPublisher:Houghton Mifflin Harcourt
Glencoe Algebra 1, Student Edition, 9780079039897...
Algebra
ISBN:9780079039897
Author:Carter
Publisher:McGraw Hill
Big Ideas Math A Bridge To Success Algebra 1: Stu...
Algebra
ISBN:9781680331141
Author:HOUGHTON MIFFLIN HARCOURT
Publisher:Houghton Mifflin Harcourt
Statistics 4.1 Point Estimators; Author: Dr. Jack L. Jackson II;https://www.youtube.com/watch?v=2MrI0J8XCEE;License: Standard YouTube License, CC-BY
Statistics 101: Point Estimators; Author: Brandon Foltz;https://www.youtube.com/watch?v=4v41z3HwLaM;License: Standard YouTube License, CC-BY
Central limit theorem; Author: 365 Data Science;https://www.youtube.com/watch?v=b5xQmk9veZ4;License: Standard YouTube License, CC-BY
Point Estimate Definition & Example; Author: Prof. Essa;https://www.youtube.com/watch?v=OTVwtvQmSn0;License: Standard Youtube License
Point Estimation; Author: Vamsidhar Ambatipudi;https://www.youtube.com/watch?v=flqhlM2bZWc;License: Standard Youtube License