
Videos
Testing the Difference Between Two Means In Exercises 9–20, (a) identify the claim and state H0 and Ha, (b) find the critical value(s) and identify the rejection region(s), (c) calculate
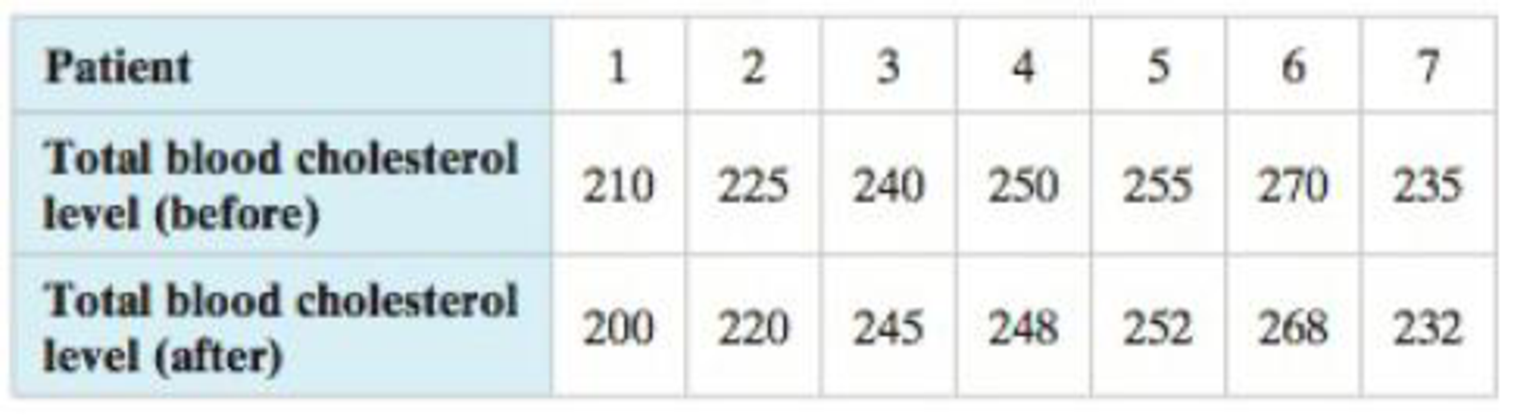
19. Cholesterol Levels A food manufacturer claims that eating its new cereal as part of a daily diet lowers total blood cholesterol levels. The table shows the total blood cholesterol levels (in milligrams per deciliter of blood) of seven patients before eating the cereal and after one year of eating the cereal as part of their diets. At α = 0.05, is there enough evidence to support the food manufacturer’s claim?
Want to see the full answer?
Check out a sample textbook solution
Chapter 8 Solutions
Elementary Statistics: Picturing the World (7th Edition)


- Apply STATA commands & submit the output for each question only when indicated below İ. ii. iii. iv. V. Apply the command summarize on variables bwght and faminc. What is the average birthweight of babies and family income of the respondents? Include the output of this code. Apply the tab command on the variable called male. How many of the babies and what share of babies are male? Include the output of this code. Find the summary statistics (i.e. use the sum command) of the variables bwght and faminc if the babies are white. Include the output of this code. Find the summary statistics (i.e. use the sum command) of the variables bwght and faminc if the babies are male but not white. Include the output of this code. Using your answers to previous subparts of this question: What is the difference between the average birthweight of a baby who is male and a baby who is male but not white? What can you say anything about the difference in family income of the babies that are male and male…arrow_forwardA public health researcher is studying the impacts of nudge marketing techniques on shoppers vegetablesarrow_forwardThe director of admissions at Kinzua University in Nova Scotia estimated the distribution of student admissions for the fall semester on the basis of past experience. Admissions Probability 1,100 0.5 1,400 0.4 1,300 0.1 Click here for the Excel Data File Required: What is the expected number of admissions for the fall semester? Compute the variance and the standard deviation of the number of admissions. Note: Round your standard deviation to 2 decimal places.arrow_forward
- A pollster randomly selected four of 10 available people. Required: How many different groups of 4 are possible? What is the probability that a person is a member of a group? Note: Round your answer to 3 decimal places.arrow_forwardWind Mountain is an archaeological study area located in southwestern New Mexico. Potsherds are broken pieces of prehistoric Native American clay vessels. One type of painted ceramic vessel is called Mimbres classic black-on-white. At three different sites the number of such sherds was counted in local dwelling excavations. Test given. Site I Site II Site III 63 19 60 43 34 21 23 49 51 48 11 15 16 46 26 20 31 Find .arrow_forwardRothamsted Experimental Station (England) has studied wheat production since 1852. Each year many small plots of equal size but different soil/fertilizer conditions are planted with wheat. At the end of the growing season, the yield (in pounds) of the wheat on the plot is measured. Suppose for a random sample of years, one plot gave the following annual wheat production (in pounds): 4.46 4.21 4.40 4.81 2.81 2.90 4.93 3.54 4.16 4.48 3.26 4.74 4.97 4.02 4.91 2.59 Use a calculator to verify that the sample variance for this plot is . Another random sample of years for a second plot gave the following annual wheat production (in pounds): 3.89 3.81 3.95 4.07 4.01 3.73 4.02 3.78 3.72 3.96 3.62 3.76 4.02 3.73 3.94 4.03 Use a calculator to verify that the sample variance for this plot is . Suppose that we test the claim using that the population variance of annual wheat production for the first plot is larger…arrow_forward
- It is thought that prehistoric Native Americans did not take their best tools, pottery, and household items when they visited higher elevations for their summer camps. It is hypothesized that archaeological sites tend to lose their cultural identity and specific cultural affiliation as the elevation of the site increases. Let x be the elevation (in thousands of feet) for an archaeological site in the southwestern United States. Let y be the percentage of unidentified artifacts (no specific cultural affiliation) at a given elevation. Suppose that the following data were obtained for a collection of archaeological sites in New Mexico: x 5.50 6.00 6.75 7.00 7.75 y 37 38 92 70 99 Find the equation of the least squares line . Round a and b to three decimal places.arrow_forwardA fitness trainer wants to estimate the effect of fitness activities on muscle mass for different weight categories of club members. They choose the most popular fitness classes at the gym: yoga, circuit training, and high-intensity interval training (HIIT). Suppose that the weights of club members are separated into three levels: under 155 pounds, 155 – 200 pounds, and over 200 pounds. Draw a flow chart showing the design of this experiment.arrow_forwardThe systolic blood pressure of individuals is thought to be related to both age and weight. Let the systolic blood pressure, age, and weight be represented by the variables x1, x2, and x3, respectively. Suppose that Minitab was used to generate the following descriptive statistics, correlations, and regression analysis for a random sample of 15 individuals. Descriptive Statistics Variable N Mean Median TrMean StDev SE Mean x 1 15 154.14 154.34 154.14 3.842 0.992000 x 2 15 59.69 60.19 59.69 1.462 0.377487 x 3 15 205.55 204.75 205.55 4.558 1.176871 Variable Minimum Maximum Q1 Q3 x 1 125 178 141.803 167.244 x 2 41 80 47.754 78.415 x 3 126 240 140.395 224.008 Correlations (Pearson) x 1 x 2 x 2 0.892 x 3 0.839 0.567 Regression Analysis The regression equation is x 1 = 0.883 + 1.257x2 + 0.871x3 Predictor Coef StDev T P Constant 0.883 0.635 1.39 0.095 x 2 1.257 0.635 1.98 0.036 x 3 0.871 0.419 2.08 0.030 S = 0.428 R-sq = 92.7 %…arrow_forward
- According to health professionals, a person’s weight is expected to increase with age. To examine that statement, a nutritionist collected data from 11 random females from different age categories between the ages of 21 and 43. In the following table, x is the age of a person and y is the weight in pounds. x, age 21 24 27 29 31 33 35 38 40 42 43 y, weight in lb 121.4 122.3 130.3 131.7 133.3 134.6 136.7 138.4 140.3 142.0 145.1 Select the correct graph of the least-squares line on a scatter diagram.arrow_forwardLet x be a random variable that represents the percentage of successful free throws a professional basketball player makes in a season. Let y be a random variable that represents the percentage of successful field goals a professional basketball player makes in a season. A random sample of n = 6 professional basketball players gave the following information. x 82 69 73 84 74 64 y 42 48 46 46 46 42 Verify that ∑x =446, ∑y =270, ∑x2 =33,442, ∑y2 =12,180, ∑xy =20,070, and r = 0, and find the critical value for a test using a 5% level of significance claiming that ρis not equal than zero. Round your answer to three decimal places.arrow_forwardLet x be a random variable that represents the percentage of successful free throws a professional basketball player makes in a season. Let y be a random variable that represents the percentage of successful field goals a professional basketball player makes in a season. A random sample of n = 6 professional basketball players gave the following information. x 75 72 75 81 74 81 y 46 39 42 47 49 50 Verify that Se ࣈ 3.591,a ࣈ –10.145, bࣈ0.729, and , and find the predicted percentage of successful field goals for a player with x= 88%successful free throws. Round your answer to the nearest tenth of a percentarrow_forward
 MATLAB: An Introduction with ApplicationsStatisticsISBN:9781119256830Author:Amos GilatPublisher:John Wiley & Sons Inc
 Probability and Statistics for Engineering and th...StatisticsISBN:9781305251809Author:Jay L. DevorePublisher:Cengage Learning
 Statistics for The Behavioral Sciences (MindTap C...StatisticsISBN:9781305504912Author:Frederick J Gravetter, Larry B. WallnauPublisher:Cengage Learning
 Elementary Statistics: Picturing the World (7th E...StatisticsISBN:9780134683416Author:Ron Larson, Betsy FarberPublisher:PEARSON
 The Basic Practice of StatisticsStatisticsISBN:9781319042578Author:David S. Moore, William I. Notz, Michael A. FlignerPublisher:W. H. Freeman
 Introduction to the Practice of StatisticsStatisticsISBN:9781319013387Author:David S. Moore, George P. McCabe, Bruce A. CraigPublisher:W. H. Freeman