Elementary Statistics: Picturing the World (7th Edition)
7th Edition
ISBN: 9780134683416
Author: Ron Larson, Betsy Farber
Publisher: PEARSON
bartleby

Concept explainers

bartleby

Videos

Textbook Question
Book Icon
Chapter 8.2, Problem 25E

Constructing Confidence Intervals for μ1 − μ2 When the sampling distribution for x ¯ 1 x ¯ 2 is approximated by a t-distribution and the populations have equal variances, you can construct a confidence interval for μ1 − μ2, as shown below.

( x ¯ 1 x ¯ 2 ) t c σ ^ 1 n 1 + 1 n 2 < μ 1 μ 2 < ( x ¯ 1 x ¯ 2 ) + t c σ ^ 1 n 1 + 1 n 2

w h e r e σ ^ = ( n 1 1 ) s 1 2 + ( n 2 1 ) s 2 2 n 1 + n 2 2 a n d d . f . = n 1 + n 2 2

In Exercises 25 and 26, construct the indicated confidence interval for μ1 − μ2. Assume the populations are approximately normal with equal variances.

25. Family Doctor To compare the mean number of days spent waiting to see a family doctor for two large cities, you randomly select several people in each city who have had an appointment with a family doctor. The results are shown at the left. Construct a 90% confidence interval for the difference in mean number of days spent waiting to see a family doctor for the two cities. (Adapted from Merritt Hawkins)
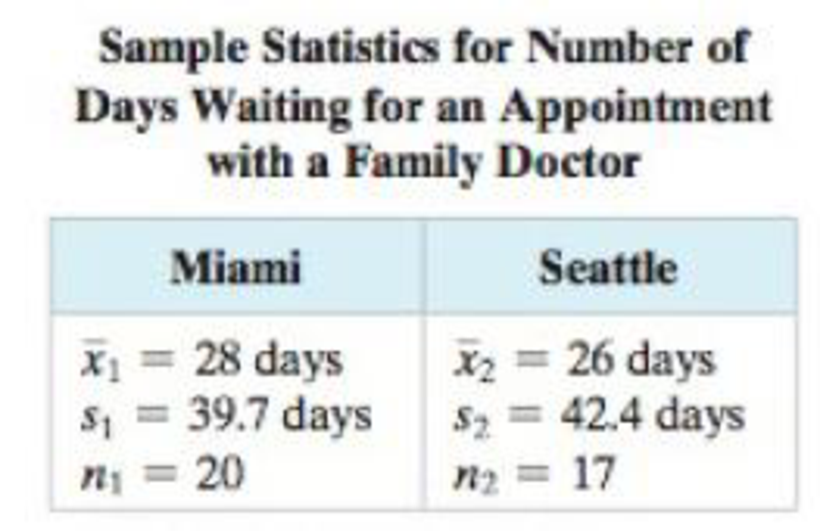
Chapter 8.2, Problem 25E, Constructing Confidence Intervals for 1  2 When the sampling distribution for x1x2 is approximated

TABLE FOR EXERCISE 25

Blurred answer
Students have asked these similar questions
Scientists need to be able to detect amounts of pollutants in the environment. Measurements were made on n 32 test specimens with a known mean concentration 2.35 ug/l of lead. It n was found that the > x; = 79.456 and > (x; – a)² = 1.0767. i=1 i=1 (a) If the population distribution of lead concentration is normal, state the minimum variance unbiased estimator of the mean. Then, compute the corresponding point estimate. Round your answer to 3 decimal places. (b) Find the estimated standard error of X. Round your answer to 3 decimal places. (c) Compute and interpret a 90% confidence interval for the true average lead concentration. (d) Did the interval you compute contain the true average? If it does not, is this a surprising result? Discuss. (e) Would you expect a wider or narrower interval if you were to compute a 95% confidence interval? Explain your answer without performing any computations.
A single sample T-test is to be done on a study about typhoons. Many believe that the average number of typhoons that enter the Philippines each year is 18 (μ ≥ 18). Some climatologists, however, observe that the true average number of typhoons that enter the Philippines each year less than 18. Science teachers from LPU collected the data about the typhoons that entered the country each year since 2018 (n = 9). The sample mean is = 17. The sample standard deviation of s = 1.5. 32. State and Null and Alternative Hypotheses. 33. What is the level of confidence? 34. What is the critical value? Hint: You will find it in the table for T-Test. 35. Write the decision rule. 36. What is the equivalent T-score of x = 17? A. 1.5 B. 7.54 C. -2.00 D. 2.67 37. What is the conclusion to this problem after performing T-Test? STANDARD NORMAL TABLE (Z) Entries in the table give the area under the curve between the mean and z standard deviations above the mean. For example, for z= 1.25 the area under the…
data consist of height measurements in centimeters of 5 randomly selected children at ages 3 and 5. Assume data are observed from 2 independent normal populations. find a 95% confidence interval of the form (0,b) for the variance of the height of children at 3 years.

Chapter 8 Solutions

Elementary Statistics: Picturing the World (7th Edition)

Ch. 8.1 - Prob. 8ECh. 8.1 - In Exercises 9 and 10, use the TI-H4 Plus display...Ch. 8.1 - Prob. 10ECh. 8.1 - Prob. 11ECh. 8.1 - In Exercises 1114, test the claim about the...Ch. 8.1 - In Exercises 1114, test the claim about the...Ch. 8.1 - Prob. 14ECh. 8.1 - Testing the Difference Between Two Means In...Ch. 8.1 - Testing the Difference Between Two Means In...Ch. 8.1 - Prob. 17ECh. 8.1 - Prob. 18ECh. 8.1 - Prob. 19ECh. 8.1 - Testing the Difference Between Two Means In...Ch. 8.1 - Testing the Difference Between Two Means In...Ch. 8.1 - Prob. 22ECh. 8.1 - Prob. 23ECh. 8.1 - Prob. 24ECh. 8.1 - Prob. 25ECh. 8.1 - Getting at the Concept Explain why the null...Ch. 8.1 - Testing a Difference Other Than Zero Sometimes a...Ch. 8.1 - Testing a Difference Other Than Zero Sometimes a...Ch. 8.1 - Prob. 29ECh. 8.1 - Architect Salaries Construct a 99% confidence...Ch. 8.2 - The annual earnings of 25 people with a high...Ch. 8.2 - A manufacturer claims that the mean driving cost...Ch. 8.2 - What conditions are necessary in order to use the...Ch. 8.2 - Explain how to perform a two-sample t-test for the...Ch. 8.2 - Prob. 3ECh. 8.2 - Prob. 4ECh. 8.2 - Prob. 5ECh. 8.2 - Prob. 6ECh. 8.2 - In Exercises 38, use Table 5 in Appendix B to find...Ch. 8.2 - Prob. 8ECh. 8.2 - In Exercises 912, test the claim about the...Ch. 8.2 - Prob. 10ECh. 8.2 - Prob. 11ECh. 8.2 - In Exercises 912, test the claim about the...Ch. 8.2 - Testing the Difference Between Two Means in...Ch. 8.2 - Testing the Difference Between Two Means in...Ch. 8.2 - Testing the Difference Between Two Means in...Ch. 8.2 - Testing the Difference Between Two Means in...Ch. 8.2 - Prob. 17ECh. 8.2 - Prob. 18ECh. 8.2 - Prob. 19ECh. 8.2 - Testing the Difference Between Two Means in...Ch. 8.2 - Testing the Difference Between Two Means in...Ch. 8.2 - Testing the Difference Between Two Means in...Ch. 8.2 - Constructing Confidence Intervals for 1 2 When...Ch. 8.2 - Constructing Confidence Intervals for 1 2 When...Ch. 8.2 - Constructing Confidence Intervals for 1 2 When...Ch. 8.2 - Prob. 26ECh. 8.2 - How Protein Affects Weight Gain in Overeaters In a...Ch. 8.2 - Prob. 2CSCh. 8.2 - How Protein Affects Weight Gain in Overeaters In a...Ch. 8.2 - Prob. 4CSCh. 8.2 - Prob. 5CSCh. 8.3 - A shoe manufacturer claims that athletes can...Ch. 8.3 - Prob. 2TYCh. 8.3 - Prob. 1ECh. 8.3 - Prob. 2ECh. 8.3 - Prob. 3ECh. 8.3 - Prob. 4ECh. 8.3 - Prob. 5ECh. 8.3 - Prob. 6ECh. 8.3 - Prob. 7ECh. 8.3 - Prob. 8ECh. 8.3 - Prob. 9ECh. 8.3 - Testing the Difference Between Two Means In...Ch. 8.3 - Prob. 11ECh. 8.3 - Prob. 12ECh. 8.3 - Prob. 13ECh. 8.3 - Testing the Difference Between Two Means In...Ch. 8.3 - Prob. 15ECh. 8.3 - Prob. 16ECh. 8.3 - Testing the Difference Between Two Means In...Ch. 8.3 - Testing the Difference Between Two Means In...Ch. 8.3 - Testing the Difference Between Two Means In...Ch. 8.3 - Prob. 20ECh. 8.3 - Prob. 21ECh. 8.3 - Prob. 22ECh. 8.3 - Prob. 23ECh. 8.3 - Prob. 24ECh. 8.4 - Consider the results of the study discussed on...Ch. 8.4 - Prob. 2TYCh. 8.4 - What conditions are necessary in order to use the...Ch. 8.4 - Explain how to perform a two-sample z-test for the...Ch. 8.4 - In Exercises 36, determine whether a normal...Ch. 8.4 - Prob. 4ECh. 8.4 - Prob. 5ECh. 8.4 - In Exercises 36, determine whether a normal...Ch. 8.4 - Prob. 7ECh. 8.4 - Testing the Difference Between Two Proportions In...Ch. 8.4 - Prob. 9ECh. 8.4 - Prob. 10ECh. 8.4 - Prob. 11ECh. 8.4 - Testing the Difference Between Two Proportions In...Ch. 8.4 - Prob. 13ECh. 8.4 - Prob. 14ECh. 8.4 - Intermarriages In Exercises 1318, use the figure,...Ch. 8.4 - Prob. 16ECh. 8.4 - Prob. 17ECh. 8.4 - Intermarriages In Exercises 1318, use the figure,...Ch. 8.4 - Prob. 19ECh. 8.4 - Prob. 20ECh. 8.4 - Prob. 21ECh. 8.4 - U.S. Workforce In Exercises 1922, use the figure...Ch. 8.4 - Prob. 23ECh. 8.4 - Prob. 24ECh. 8.4 - Prob. 25ECh. 8.4 - Prob. 26ECh. 8 - Uses Hypothesis Testing with Two Samples...Ch. 8 - Medical research often involves blind and...Ch. 8 - Prob. 8.1.1RECh. 8 - Prob. 8.1.2RECh. 8 - Sample 1: The fuel efficiencies of 20 sports...Ch. 8 - Prob. 8.1.4RECh. 8 - Prob. 8.1.5RECh. 8 - In Exercises 58, test the claim about the...Ch. 8 - Prob. 8.1.7RECh. 8 - In Exercises 58, test the claim about the...Ch. 8 - In Exercises 9 and 10, (a) identify the claim and...Ch. 8 - Prob. 8.1.10RECh. 8 - Prob. 8.2.11RECh. 8 - Prob. 8.2.12RECh. 8 - Prob. 8.2.13RECh. 8 - Prob. 8.2.14RECh. 8 - Prob. 8.2.15RECh. 8 - Prob. 8.2.16RECh. 8 - Prob. 8.2.17RECh. 8 - Prob. 8.2.18RECh. 8 - Prob. 8.3.19RECh. 8 - In Exercises 1922, test the claim about the mean...Ch. 8 - Prob. 8.3.21RECh. 8 - Prob. 8.3.22RECh. 8 - Prob. 8.3.23RECh. 8 - In Exercises 23 and 24, (a) identify the claim and...Ch. 8 - Prob. 8.4.25RECh. 8 - Prob. 8.4.26RECh. 8 - Prob. 8.4.27RECh. 8 - Prob. 8.4.28RECh. 8 - Prob. 8.4.29RECh. 8 - Prob. 8.4.30RECh. 8 - Prob. 1CQCh. 8 - Prob. 2CQCh. 8 - Prob. 3CQCh. 8 - Prob. 4CQCh. 8 - Take this test as you would take a test in class....Ch. 8 - Prob. 2CTCh. 8 - A physical therapist suggests that soft tissue...Ch. 8 - Take this test as you would take a test in class....Ch. 8 - The U.S. Department of Health Human Services...Ch. 8 - Prob. 2RSRDCh. 8 - Prob. 3RSRDCh. 8 - Prob. 4RSRDCh. 8 - Prob. 1TCh. 8 - Prob. 2TCh. 8 - Prob. 3TCh. 8 - Prob. 4TCh. 8 - Prob. 5TCh. 8 - Prob. 1CRCh. 8 - Prob. 2CRCh. 8 - Prob. 3CRCh. 8 - Prob. 4CRCh. 8 - In Exercises 36, construct the indicated...Ch. 8 - In Exercises 36, construct the indicated...Ch. 8 - In Exercises 710, the statement represents a...Ch. 8 - In Exercises 710, the statement represents a...Ch. 8 - In Exercises 710, the statement represents a...Ch. 8 - In Exercises 710, the statement represents a...Ch. 8 - Prob. 11CRCh. 8 - Prob. 12CRCh. 8 - Prob. 13CRCh. 8 - Prob. 14CRCh. 8 - Prob. 15CRCh. 8 - Prob. 16CRCh. 8 - A researcher claims that 5% of people who wear...
Knowledge Booster
Background pattern image
Statistics
Learn more about
Need a deep-dive on the concept behind this application? Look no further. Learn more about this topic, statistics and related others by exploring similar questions and additional content below.
Similar questions
Recommended textbooks for you
Text book image
Linear Algebra: A Modern Introduction
Algebra
ISBN:9781285463247
Author:David Poole
Publisher:Cengage Learning
Text book image
Big Ideas Math A Bridge To Success Algebra 1: Stu...
Algebra
ISBN:9781680331141
Author:HOUGHTON MIFFLIN HARCOURT
Publisher:Houghton Mifflin Harcourt
Statistics 4.1 Point Estimators; Author: Dr. Jack L. Jackson II;https://www.youtube.com/watch?v=2MrI0J8XCEE;License: Standard YouTube License, CC-BY
Statistics 101: Point Estimators; Author: Brandon Foltz;https://www.youtube.com/watch?v=4v41z3HwLaM;License: Standard YouTube License, CC-BY
Central limit theorem; Author: 365 Data Science;https://www.youtube.com/watch?v=b5xQmk9veZ4;License: Standard YouTube License, CC-BY
Point Estimate Definition & Example; Author: Prof. Essa;https://www.youtube.com/watch?v=OTVwtvQmSn0;License: Standard Youtube License
Point Estimation; Author: Vamsidhar Ambatipudi;https://www.youtube.com/watch?v=flqhlM2bZWc;License: Standard Youtube License