Concept explainers
Consider the function
Find the real zeros and their multiplicity.
Find the intercepts.
Find the power function that the graph of
Graph
Approximate the turning points, if any exist.
Use the information obtained in parts
Identify the intervals on which
(a)
The real zeros of
Answer to Problem 11CR
Solution:
The real zeros of
Explanation of Solution
Given information:
The function,
Explanation:
Consider the function
By rational root theorem,
The divisors of the constant term are
The divisors of the leading coefficient are
Then, possible rational zeros of the polynomial are,
Now, test
Here, since the remainder is
After taking
Then, the depressed equation is
By quadratic formula, the zeros of the quadratic equation
The factors of
The factor form of
Hence, the real zeros of
is
(b)
The
Answer to Problem 11CR
Solution:
The
Explanation of Solution
Given information:
The function
Explanation:
To find
Thus the
Now to find
Hence the
(c)
The power function that the graph of
Answer to Problem 11CR
Solution:
Thegraph of the function
Explanation of Solution
Given information:
The function
The polynomial function is
Here the degree of the polynomial function
The graph of the function
(d)
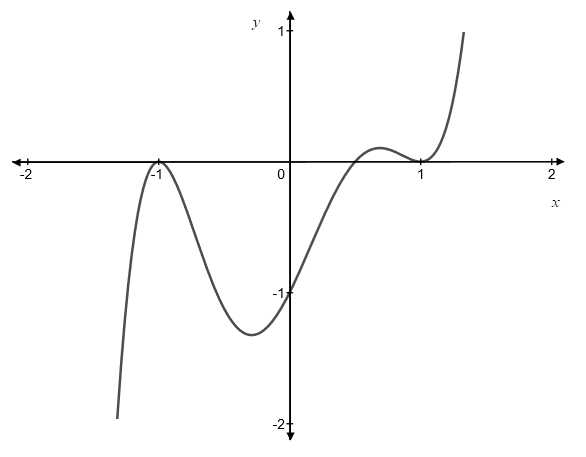
To graph: The function
Explanation of Solution
Given information:
The function
Graph:
Use the steps below to graph the function using a graphing calculator.
Step I: Press the ON key.
Step II: Now, press [Y=]. Input the right hand side of the function
Step III: Press [WINDOW] key and set the viewing window as below,
Step IV: Then hit [Graph] key to view the graph.
The graph of the function is as follows:

Interpretation:
The graph of the function
(e)
The approximation of the turning points, if exists, of the function
Answer to Problem 11CR
Solution:
The turning points of
Explanation of Solution
Given information:
The function
Explanation:
Let, the function
The maximum number of real zeros is the degree of the polynomial.
Here, the degree of
Since the polynomial function
For the approximation of the turning points find out the maxima and minima using a graphing calculator.
To graph the function
Step I: Press the ON key.
Step II: Now, press [Y=]. Input the right hand side of the function
Step III: Press [WINDOW] key and set the viewing window as below,
Step IV: Then hit [Graph] key to view the graph.
The graph of the function is as follows:

To find local maximum and local minimum on the graph using graphing utility use below steps,
Step IV: Press [2ND] [TRACE] to access the calculate menu
Step V: press [MAXIMUM] and press [ENTER].
Step VI: Set left bound by using the left and right arrow. Click [ENTER].
Step VII: Set right bound by using the left and right arrow. Click [ENTER].
Step VIII: Click [Enter] button twice.
It will give the maximum value
It will give the maximum value
Thus, the function have its local maximum value at
To find local minimum value use below steps.
Step IX: Press [2ND] [TRACE] to access the calculate menu
Step X: press [MINIMUM] and press [ENTER].
Step XI: Set left bound by using the left and right arrow. Click [ENTER].
Step XII: Set right bound by using the left and right arrow. Click [ENTER].
Step XIII: Click [Enter] button twice.
It will give the minimum value
It will give the minimum value
Thus, the function has its local minimum value at
Therefore, the turning points are
(f)
To graph: The function
Explanation of Solution
Given information:
The function
Graph:
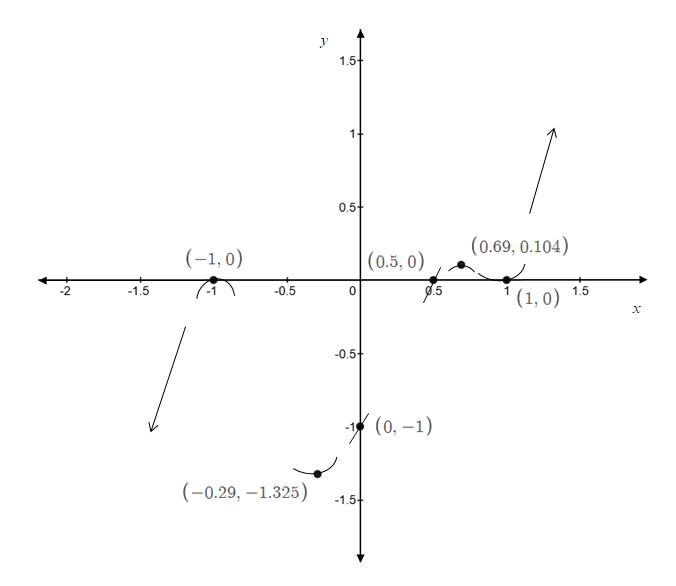
The polynomial function is
From all the above parts, the analysis of the function
The graph of the function
Thezeros of the function are
The
The graph of the function
Here the degree of the polynomial function
Using all this information, the graph will look alike:

Now find additional points on the graph on each side of
For
For
For
For
For
For
For
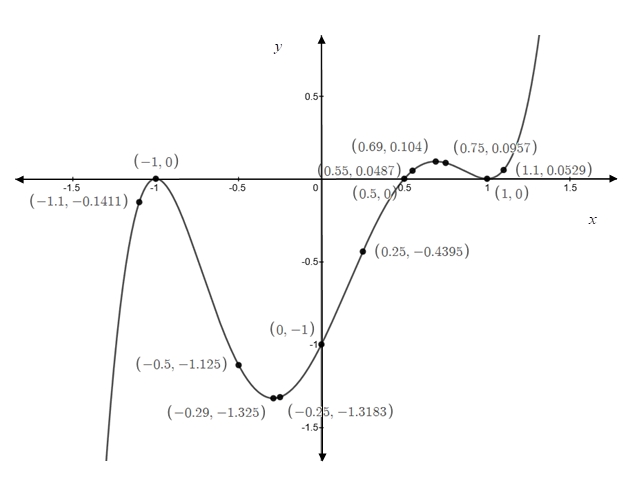
Now plot all these coordinates
Therefore, the graph of the function is as follows:

Interpretation:
The graph of the function
Thezeros of the function are
The
The graph of the function
Here the degree of the polynomial function
(g)
The intervals where the function
Answer to Problem 11CR
Solution:
The function
Explanation of Solution
Given information:
The function,
The polynomial function is
From parts (d),(e),(f) the graph of the function

Here the degree of the polynomial function
From the graph, it is clearly evident the graph is increasing in the interval
Chapter 7 Solutions
Precalculus
Additional Math Textbook Solutions
Calculus: Early Transcendentals (2nd Edition)
Pre-Algebra Student Edition
Thinking Mathematically (6th Edition)
Basic Business Statistics, Student Value Edition
College Algebra (7th Edition)
Elementary Statistics: Picturing the World (7th Edition)
- Consider the following system of equations, Ax=b : x+2y+3z - w = 2 2x4z2w = 3 -x+6y+17z7w = 0 -9x-2y+13z7w = -14 a. Find the solution to the system. Write it as a parametric equation. You can use a computer to do the row reduction. b. What is a geometric description of the solution? Explain how you know. c. Write the solution in vector form? d. What is the solution to the homogeneous system, Ax=0?arrow_forward2. Find a matrix A with the following qualities a. A is 3 x 3. b. The matrix A is not lower triangular and is not upper triangular. c. At least one value in each row is not a 1, 2,-1, -2, or 0 d. A is invertible.arrow_forwardFind the exact area inside r=2sin(2\theta ) and outside r=\sqrt(3)arrow_forward
- A 20 foot ladder rests on level ground; its head (top) is against a vertical wall. The bottom of the ladder begins by being 12 feet from the wall but begins moving away at the rate of 0.1 feet per second. At what rate is the top of the ladder slipping down the wall? You may use a calculator.arrow_forwardExplain the focus and reasons for establishment of 12.4.1(root test) and 12.4.2(ratio test)arrow_forwarduse Integration by Parts to derive 12.6.1arrow_forward
- Explain the relationship between 12.3.6, (case A of 12.3.6) and 12.3.7arrow_forwardExplain the key points and reasons for the establishment of 12.3.2(integral Test)arrow_forwardUse 12.4.2 to determine whether the infinite series on the right side of equation 12.6.5, 12.6.6 and 12.6.7 converges for every real number x.arrow_forward
 Calculus: Early TranscendentalsCalculusISBN:9781285741550Author:James StewartPublisher:Cengage Learning
 Thomas' Calculus (14th Edition)CalculusISBN:9780134438986Author:Joel R. Hass, Christopher E. Heil, Maurice D. WeirPublisher:PEARSON
 Calculus: Early Transcendentals (3rd Edition)CalculusISBN:9780134763644Author:William L. Briggs, Lyle Cochran, Bernard Gillett, Eric SchulzPublisher:PEARSON
 Calculus: Early TranscendentalsCalculusISBN:9781319050740Author:Jon Rogawski, Colin Adams, Robert FranzosaPublisher:W. H. Freeman
 Calculus: Early Transcendental FunctionsCalculusISBN:9781337552516Author:Ron Larson, Bruce H. EdwardsPublisher:Cengage Learning


