
Videos
(a)
To find: The
(a)
Explanation of Solution
Given:
The given table is shown in table 1
Table 1
| Month, | Average Monthly Temperature, |
| January 1 | 25.5 |
| February 2 | 29.6 |
| March 3 | 41.4 |
| April 4 | 52.4 |
| May 5 | 62.8 |
| June 6 | 71.9 |
| July 7 | 75.4 |
| August 8 | 73.2 |
| September 9 | 66.6 |
| October 10 | 54.7 |
| November 11 | 43.0 |
| December 12 | 30.9 |
Calculation:
The scatter plot of the given data is shown in Figure 1
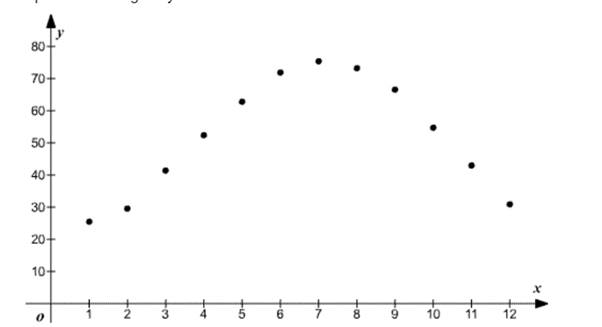
Figure 1
(b)
To find: The sinusoidal function of the given form.
(b)
Answer to Problem 31AYU
The required sinusoidal function is
Explanation of Solution
Given:
The given form of the sinusoidal function is,
Calculation:
Consider the given sine function is,
Consider the amplitude
Then,
Consider the expression for the vertical shift of the sinusoidal function is,
Then,
Consider the expression for the time period of the data is,
As the data repeats after every 12 months, then,
Consider the horizontal shift is determined by dividing the 12 in four equal parts as,
Since, the curve increases in the interval of
Then, the expression for the sinusoidal function is,
(c)
To find: The scatter plot for the function found in part (b).
(c)
Answer to Problem 31AYU
The required plot is shown in Figure 2
Explanation of Solution
Consider the sinusoidal function is,
The graph for the sinusoidal model is shown in Figure 2
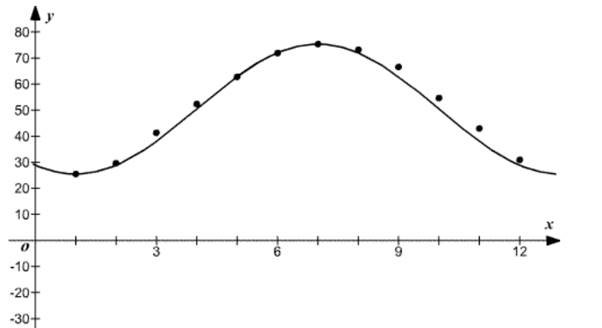
Figure 2
(d)
To find: The sinusoidal function of the best fit model.
(d)
Answer to Problem 31AYU
The best fit model is
Explanation of Solution
The best fit model with the help of graphing calculator is,
(e)
To find: The sinusoidal function of best fit on the scatter diagram of the data.
(e)
Answer to Problem 31AYU
The plot for the best fit model is shown in Figure 3
Explanation of Solution
Consider the best fit model is,
The sinusoidal plot for the best fit model is shown in Figure 3
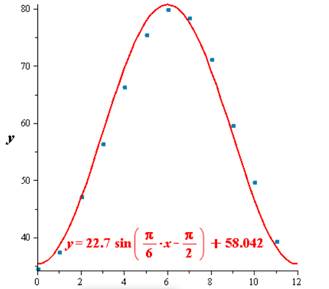
Figure 3
Chapter 6 Solutions
Precalculus
Additional Math Textbook Solutions
A First Course in Probability (10th Edition)
Pre-Algebra Student Edition
Elementary Statistics (13th Edition)
College Algebra (7th Edition)


- Evaluate the double integral ' √ √ (−2xy² + 3ry) dA R where R = {(x,y)| 1 ≤ x ≤ 3, 2 ≤ y ≤ 4} Double Integral Plot of integrand and Region R N 120 100 80- 60- 40 20 -20 -40 2 T 3 4 5123456 This plot is an example of the function over region R. The region and function identified in your problem will be slightly different. Answer = Round your answer to four decimal places.arrow_forwardFind Te²+ dydz 0 Write your answer in exact form.arrow_forwardxy² Find -dA, R = [0,3] × [−4,4] x²+1 Round your answer to four decimal places.arrow_forward
- Find the values of p for which the series is convergent. P-?- ✓ 00 Σ nº (1 + n10)p n = 1 Need Help? Read It Watch It SUBMIT ANSWER [-/4 Points] DETAILS MY NOTES SESSCALCET2 8.3.513.XP. Consider the following series. 00 Σ n = 1 1 6 n° (a) Use the sum of the first 10 terms to estimate the sum of the given series. (Round the answer to six decimal places.) $10 = (b) Improve this estimate using the following inequalities with n = 10. (Round your answers to six decimal places.) Sn + + Los f(x) dx ≤s ≤ S₁ + Jn + 1 + Lo f(x) dx ≤s ≤ (c) Using the Remainder Estimate for the Integral Test, find a value of n that will ensure that the error in the approximation s≈s is less than 0.0000001. On > 11 n> -18 On > 18 On > 0 On > 6 Need Help? Read It Watch Itarrow_forward√5 Find Lª³ L² y-are y- arctan (+) dy dydx. Hint: Use integration by parts. SolidUnderSurface z=y*arctan(1/x) Z1 2 y 1 1 Round your answer to 4 decimal places.arrow_forwardFor the solid lying under the surface z = √√4-² and bounded by the rectangular region R = [0,2]x[0,2] as illustrated in this graph: Double Integral Plot of integrand over Region R 1.5 Z 1- 0.5- 0 0.5 1 1.5 205115 Answer should be in exact math format. For example, some multiple of .arrow_forward
- Find 2 S² 0 0 (4x+2y)5dxdyarrow_forward(14 points) Let S = {(x, y, z) | z = e−(x²+y²), x² + y² ≤ 1}. The surface is the graph of ze(+2) sitting over the unit disk.arrow_forward6. Solve the system of differential equations using Laplace Transforms: x(t) = 3x₁ (t) + 4x2(t) x(t) = -4x₁(t) + 3x2(t) x₁(0) = 1,x2(0) = 0arrow_forward
- 3. Determine the Laplace Transform for the following functions. Show all of your work: 1-t, 0 ≤t<3 a. e(t) = t2, 3≤t<5 4, t≥ 5 b. f(t) = f(tt)e-3(-) cos 4τ drarrow_forward4. Find the inverse Laplace Transform Show all of your work: a. F(s) = = 2s-3 (s²-10s+61)(5-3) se-2s b. G(s) = (s+2)²arrow_forward1. Consider the differential equation, show all of your work: dy =(y2)(y+1) dx a. Determine the equilibrium solutions for the differential equation. b. Where is the differential equation increasing or decreasing? c. Where are the changes in concavity? d. Suppose that y(0)=0, what is the value of y as t goes to infinity?arrow_forward
 Calculus: Early TranscendentalsCalculusISBN:9781285741550Author:James StewartPublisher:Cengage Learning
 Thomas' Calculus (14th Edition)CalculusISBN:9780134438986Author:Joel R. Hass, Christopher E. Heil, Maurice D. WeirPublisher:PEARSON
 Calculus: Early Transcendentals (3rd Edition)CalculusISBN:9780134763644Author:William L. Briggs, Lyle Cochran, Bernard Gillett, Eric SchulzPublisher:PEARSON
 Calculus: Early TranscendentalsCalculusISBN:9781319050740Author:Jon Rogawski, Colin Adams, Robert FranzosaPublisher:W. H. Freeman
 Calculus: Early Transcendental FunctionsCalculusISBN:9781337552516Author:Ron Larson, Bruce H. EdwardsPublisher:Cengage Learning