
Videos
(a)
To find: The
(a)
Answer to Problem 29AYU
The scatter plot is shown in Figure 1
Explanation of Solution
Given:
The given data is shown in Table 1
Table 1
| Month | Average Monthly Temperature F |
| 1 | 24.2 |
| 2 | 28.4 |
| 3 | 32.7 |
| 4 | 39.7 |
| 5 | 47.0 |
| 6 | 53.0 |
| 7 | 56.0 |
| 8 | 55.0 |
| 9 | 49.4 |
| 10 | 42.2 |
| 11 | 32.0 |
| 12 | 27.1 |
Calculation:
The data of the table represents the average monthly temperature over a period of one year. The scatter diagram is drawn by taking months along the x axis and the average monthly temperature along the y axis.
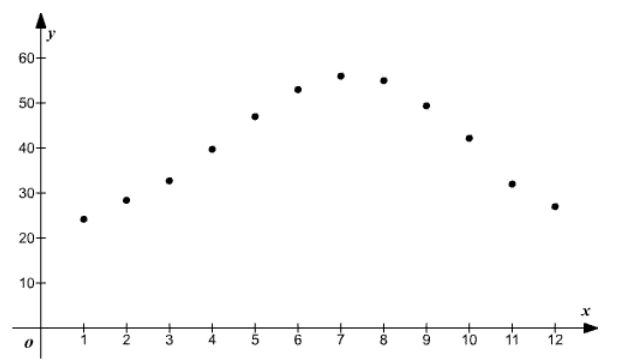
Figure 1
(b)
To find: The sinusoidal function of the form
(b)
Answer to Problem 29AYU
The sinusoidal model is
Explanation of Solution
Consider the form of the sinusoidal function is,
Consider the amplitude of the sinusoidal function is,
Consider the value of the vertical shift is,
Consider the time period of the sinusoidal function is,
The time is divided into four sub intervals as
The local maximum is at
The local minimum is at
The required horizontal shift is 4 units to the right.
So, the sinusoidal model is,
(c)
To find: The scatter diagram for the sinusoidal function found in part (c).
(c)
Explanation of Solution
Consider the sinusoidal function is,
The sinusoidal function scatter plot with the help of graphing utility is shown in Figure 2

Figure 2
(d)
To find: The best fit sinusoidal function.
(d)
Answer to Problem 29AYU
The expression for the best fit curve is
Explanation of Solution
Consider the sinusoidal function is,
Consider the best fit curve with the help of graphing utility is,
(e)
To find: The plot of sinusoidal function of best fit.
(e)
Answer to Problem 29AYU
The plot is shown in Figure 3
Explanation of Solution
Consider the best fit function is,
The scatter plot for the best fit function is shown in Figure 3
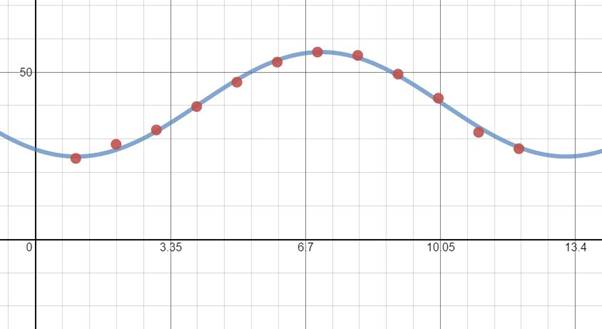
Figure 3
Chapter 6 Solutions
Precalculus
Additional Math Textbook Solutions
University Calculus: Early Transcendentals (4th Edition)
Elementary Statistics
A First Course in Probability (10th Edition)
Intro Stats, Books a la Carte Edition (5th Edition)


- 8. For x>_1, the continuous function g is decreasing and positive. A portion of the graph of g is shown above. For n>_1, the nth term of the series summation from n=1 to infinity a_n is defined by a_n=g(n). If intergral 1 to infinity g(x)dx converges to 8, which of the following could be true? A) summation n=1 to infinity a_n = 6. B) summation n=1 to infinity a_n =8. C) summation n=1 to infinity a_n = 10. D) summation n=1 to infinity a_n diverges.arrow_forwardPLEASE SHOW ME THE RIGHT ANSWER/SOLUTION SHOW ME ALL THE NEDDED STEP 13: If the perimeter of a square is shrinking at a rate of 8 inches per second, find the rate at which its area is changing when its area is 25 square inches.arrow_forwardDO NOT GIVE THE WRONG ANSWER SHOW ME ALL THE NEEDED STEPS 11: A rectangle has a base that is growing at a rate of 3 inches per second and a height that is shrinking at a rate of one inch per second. When the base is 12 inches and the height is 5 inches, at what rate is the area of the rectangle changing?arrow_forward
- please answer by showing all the dfalowing necessary step DO NOT GIVE ME THE WRONG ANSWER The sides of a cube of ice are melting at a rate of 1 inch per hour. When its volume is 64 cubic inches, at what rate is its volume changing?arrow_forwardSox & Sin (px) dx 0arrow_forward8 L 8 e ipx dxarrow_forward
- Find the Taylor polynomial T³(×) for the function f centered at the number a. f(x) = xe-2x a = 0 T3(x) =arrow_forwardFor each graph in Figure 16, determine whether f (1) is larger or smaller than the slope of the secant line between x = 1 and x = 1 + h for h > 0. Explain your reasoningarrow_forwardPoints z1 and z2 are shown on the graph.z1 is at (4 real,6 imaginary), z2 is at (-5 real, 2 imaginary)Part A: Identify the points in standard form and find the distance between them.Part B: Give the complex conjugate of z2 and explain how to find it geometrically.Part C: Find z2 − z1 geometrically and explain your steps.arrow_forward
- A polar curve is represented by the equation r1 = 7 + 4cos θ.Part A: What type of limaçon is this curve? Justify your answer using the constants in the equation.Part B: Is the curve symmetrical to the polar axis or the line θ = pi/2 Justify your answer algebraically.Part C: What are the two main differences between the graphs of r1 = 7 + 4cos θ and r2 = 4 + 4cos θ?arrow_forwardA curve, described by x2 + y2 + 8x = 0, has a point A at (−4, 4) on the curve.Part A: What are the polar coordinates of A? Give an exact answer.Part B: What is the polar form of the equation? What type of polar curve is this?Part C: What is the directed distance when Ø = 5pi/6 Give an exact answer.arrow_forwardNew folder 10. Find the area enclosed by the loop of the curve (1- t², t-t³)arrow_forward
 Calculus: Early TranscendentalsCalculusISBN:9781285741550Author:James StewartPublisher:Cengage Learning
 Thomas' Calculus (14th Edition)CalculusISBN:9780134438986Author:Joel R. Hass, Christopher E. Heil, Maurice D. WeirPublisher:PEARSON
 Calculus: Early Transcendentals (3rd Edition)CalculusISBN:9780134763644Author:William L. Briggs, Lyle Cochran, Bernard Gillett, Eric SchulzPublisher:PEARSON
 Calculus: Early TranscendentalsCalculusISBN:9781319050740Author:Jon Rogawski, Colin Adams, Robert FranzosaPublisher:W. H. Freeman
 Calculus: Early Transcendental FunctionsCalculusISBN:9781337552516Author:Ron Larson, Bruce H. EdwardsPublisher:Cengage Learning