Concept explainers
Videos
To draw: The
Answer to Problem 1E
Explanation of Solution
Given: The table shows number minutes out of 8 hours work day.
In table shows number of minutes out of each eight- hour work day for various years.
Let t =30 represents year corresponding to 1930 .
Now plot the scatter plot and draw each regression on graph.
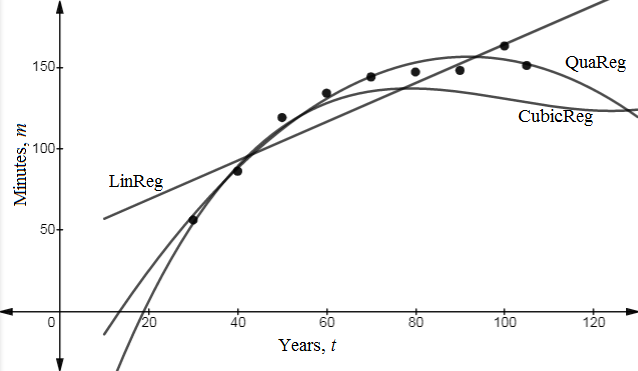
Using graph the equation of regression,
Linear regression,
Quadratic regression,
Cubic regression,
So, coefficient of regression constant is nearest to 1 for cubic regression. Best fit curve would be cubic.
Chapter 6 Solutions
Algebra 2
Additional Math Textbook Solutions
Calculus: Early Transcendentals (2nd Edition)
Elementary Statistics (13th Edition)
Algebra and Trigonometry (6th Edition)
A Problem Solving Approach To Mathematics For Elementary School Teachers (13th Edition)
University Calculus: Early Transcendentals (4th Edition)
Basic Business Statistics, Student Value Edition


- In simplest terms, Sketch the graph of the parabola. Then, determine its equation. opens downward, vertex is (- 4, 7), passes through point (0, - 39)arrow_forwardIn simplest way, For each quadratic relation, find the zeros and the maximum or minimum. a) y = x 2 + 16 x + 39 b) y = 5 x2 - 50 x - 120arrow_forwardIn simplest terms and step by step Write each quadratic relation in standard form, then fi nd the zeros. y = - 4( x + 6)2 + 36arrow_forward
- In simplest terms and step by step For each quadratic relation, find the zeros and the maximum or minimum. 1) y = - 2 x2 - 28 x + 64 2) y = 6 x2 + 36 x - 42arrow_forwardWrite each relation in standard form a)y = 5(x + 10)2 + 7 b)y = 9(x - 8)2 - 4arrow_forwardIn simplest form and step by step Write the quadratic relation in standard form, then fi nd the zeros. y = 3(x - 1)2 - 147arrow_forward
- Step by step instructions The path of a soccer ball can be modelled by the relation h = - 0.1 d 2 + 0.5 d + 0.6, where h is the ball’s height and d is the horizontal distance from the kicker. a) Find the zeros of the relation.arrow_forwardIn simplest terms and step by step how do you find the zeros of y = 6x2 + 24x - 192arrow_forwardStep by step Find the zeros of each quadratic relation. a) y = x2 - 16xarrow_forward
- In simplest step by step terms, how do you find the zeros of y = x2 - 16arrow_forwardIn simplest terms, Describe the shape and position of the parabola relative to the graph of y = x 2 y = - 80( x + 9) 2 + 10.8arrow_forwardas a Identify each equation Parabola, circle, ellipse perbola without completio the square. x²-6x-14 y = 33-y² 14y ofarrow_forward
 Algebra and Trigonometry (6th Edition)AlgebraISBN:9780134463216Author:Robert F. BlitzerPublisher:PEARSON
 Contemporary Abstract AlgebraAlgebraISBN:9781305657960Author:Joseph GallianPublisher:Cengage Learning
 Linear Algebra: A Modern IntroductionAlgebraISBN:9781285463247Author:David PoolePublisher:Cengage Learning
 Algebra And Trigonometry (11th Edition)AlgebraISBN:9780135163078Author:Michael SullivanPublisher:PEARSON
 Introduction to Linear Algebra, Fifth EditionAlgebraISBN:9780980232776Author:Gilbert StrangPublisher:Wellesley-Cambridge Press
 College Algebra (Collegiate Math)AlgebraISBN:9780077836344Author:Julie Miller, Donna GerkenPublisher:McGraw-Hill Education