Concept explainers
Videos
(a)
To sketch: The graph of the function by making the table containing its value.
(a)
Answer to Problem 17PPS
The graph of the function is curve and it’s shown in graph above in red curve.
Explanation of Solution
Given:
Concept used:
The graph of the function
The graph can be defined by the graph of
The graph of the function is special case of the graph of an equation.
Calculation:
Table of values and graph.
Using different value of
The graph of the function
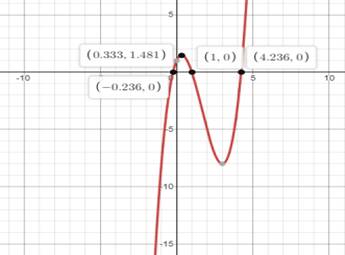
Hence, the graph of the function is curve and it’s shown in graph above in red curve.
(b)
To find: The consecutive integer value of x between the zeroes is located.
(b)
Answer to Problem 17PPS
The zeroes of the function lied
And in between
Explanation of Solution
Given:
Concept used:
The zeroes of the function resembled the function equates to zero.
The zero normally lies in between negative number and positive number.
Therefore, the consecutive number will negative approaches zero and positive approaches to zero except
Calculation:
Table of values and graph.
Using different value of
The points in the graph so collected will form a graph for the given equation.
The changes in sign from the result indicates that there are zeroes at
And in between
Since, the sign of the function changes from negative to positive.
Hence the zeroes of the function lied
And in between
(c)
To find: The Abscissa of the relative
(c)
Answer to Problem 17PPS
The
Explanation of Solution
Given:
Concept used:
Relative maxima:
Which is greater point than the points directly beside it at both sides.
Whereas,
Relative minimum:
Any point which is lesser than the points directly beside it at both sides.
Calculation:
The relative maxima and minima can be calculated as:
The value of
The value of
Hence relative maximum lied near
Chapter 6 Solutions
Algebra 2
Additional Math Textbook Solutions
Elementary Statistics (13th Edition)
Pre-Algebra Student Edition
A Problem Solving Approach To Mathematics For Elementary School Teachers (13th Edition)
Basic Business Statistics, Student Value Edition
Using and Understanding Mathematics: A Quantitative Reasoning Approach (6th Edition)
University Calculus: Early Transcendentals (4th Edition)


- The following is the graph of the function f. 48- 44 40 36 32 28 24 20 16 12 8 4 -4 -3 -1 -4 -8 -12 -16 -20 -24 -28 -32 -36 -40 -44 -48+ Estimate the intervals where f is increasing or decreasing. Increasing: Decreasing: Estimate the point at which the graph of ƒ has a local maximum or a local minimum. Local maximum: Local minimum:arrow_forwardFor the following exercise, find the domain and range of the function below using interval notation. 10+ 9 8 7 6 5 4 3 2 1 10 -9 -8 -7 -6 -5 -4 -3 -2 -1 2 34 5 6 7 8 9 10 -1 -2 Domain: Range: -4 -5 -6 -7- 67% 9 -8 -9 -10-arrow_forward1. Given that h(t) = -5t + 3 t². A tangent line H to the function h(t) passes through the point (-7, B). a. Determine the value of ẞ. b. Derive an expression to represent the gradient of the tangent line H that is passing through the point (-7. B). c. Hence, derive the straight-line equation of the tangent line H 2. The function p(q) has factors of (q − 3) (2q + 5) (q) for the interval -3≤ q≤ 4. a. Derive an expression for the function p(q). b. Determine the stationary point(s) of the function p(q) c. Classify the stationary point(s) from part b. above. d. Identify the local maximum of the function p(q). e. Identify the global minimum for the function p(q). 3. Given that m(q) = -3e-24-169 +9 (-39-7)(-In (30-755 a. State all the possible rules that should be used to differentiate the function m(q). Next to the rule that has been stated, write the expression(s) of the function m(q) for which that rule will be applied. b. Determine the derivative of m(q)arrow_forward
- Safari File Edit View History Bookmarks Window Help Ο Ω OV O mA 0 mW ర Fri Apr 4 1 222 tv A F9 F10 DII 4 F6 F7 F8 7 29 8 00 W E R T Y U S D பட 9 O G H J K E F11 + 11 F12 O P } [arrow_forwardSo confused. Step by step instructions pleasearrow_forwardIn simplest terms, Sketch the graph of the parabola. Then, determine its equation. opens downward, vertex is (- 4, 7), passes through point (0, - 39)arrow_forward
- In simplest way, For each quadratic relation, find the zeros and the maximum or minimum. a) y = x 2 + 16 x + 39 b) y = 5 x2 - 50 x - 120arrow_forwardIn simplest terms and step by step Write each quadratic relation in standard form, then fi nd the zeros. y = - 4( x + 6)2 + 36arrow_forwardIn simplest terms and step by step For each quadratic relation, find the zeros and the maximum or minimum. 1) y = - 2 x2 - 28 x + 64 2) y = 6 x2 + 36 x - 42arrow_forward
- Write each relation in standard form a)y = 5(x + 10)2 + 7 b)y = 9(x - 8)2 - 4arrow_forwardIn simplest form and step by step Write the quadratic relation in standard form, then fi nd the zeros. y = 3(x - 1)2 - 147arrow_forwardStep by step instructions The path of a soccer ball can be modelled by the relation h = - 0.1 d 2 + 0.5 d + 0.6, where h is the ball’s height and d is the horizontal distance from the kicker. a) Find the zeros of the relation.arrow_forward
 Algebra and Trigonometry (6th Edition)AlgebraISBN:9780134463216Author:Robert F. BlitzerPublisher:PEARSON
 Contemporary Abstract AlgebraAlgebraISBN:9781305657960Author:Joseph GallianPublisher:Cengage Learning
 Linear Algebra: A Modern IntroductionAlgebraISBN:9781285463247Author:David PoolePublisher:Cengage Learning
 Algebra And Trigonometry (11th Edition)AlgebraISBN:9780135163078Author:Michael SullivanPublisher:PEARSON
 Introduction to Linear Algebra, Fifth EditionAlgebraISBN:9780980232776Author:Gilbert StrangPublisher:Wellesley-Cambridge Press
 College Algebra (Collegiate Math)AlgebraISBN:9780077836344Author:Julie Miller, Donna GerkenPublisher:McGraw-Hill Education