Videos
a.
Sketch a
a.
Answer to Problem 9P
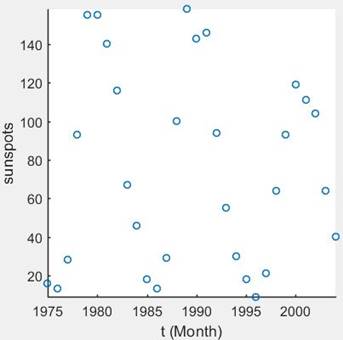
The scatter plot is
Explanation of Solution
Given: A set of the data is,
Calculation:
Let’s take a given data set sketch a scatter plot using MATLAB.
The function is using in the MATLAB to sketch a scatter plot is,
Program:
clc
clear
close all
t=1975:1:2004;
y=[16 13 28 93 155 155 140 116 67 46 18 13 29 100 158 ...
    143 146 94 55 30 18 9 21 64 93 119 111 104 64 40];
scatter(t,y,'linewidth',1.25');
set(gca,'Linewidth',1.2,'Fontsize',12);
xlabel('t (Month)');
ylabel('sunspots')
axis square
axis tight
Query:
- First, we have defined the given data sets.
- Then using a function “scatter (t, y)” sketch a scatter plot.
b.
Calculate the cosine function using given data set.
b.
Answer to Problem 9P
The cosine function is,
Explanation of Solution
Given: A set of the data is,
Calculation:
First, we have to write a general equation of the cosine function,
Then, calculate the vertical shifting as,
Calculate the amplitude as,
Then, Calculate the phase shift as,
The value of c is,
Put all the value into the equation (1) then,
Program:
clc
clear
close all
t=1975:1:2004;
y=[16 13 28 93 155 155 140 116 67 46 18 13 29 100 158 ...
    143 146 94 55 30 18 9 21 64 93 119 111 104 64 40];
b=(1/2)*(max(y)+min(y));
a=(1/2)*(max(y)-min(y));
w=2*pi/30;
idx=find(y==max(y));
c=t(idx);
f=(a*cos(w*(t-c)))+b;
Query:
- First, we have defined the given data sets.
- Then calculate the value of b, a, w, and c.
- Put all the values into the equation of cosine function and get the solution.
c.
Sketch a graph of the function which is found in part (b).
c.
Answer to Problem 9P
The solution is,
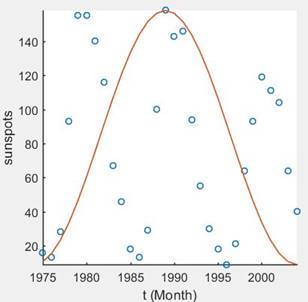
Explanation of Solution
Given: A set of the data is,
Calculation:
Sketch a graph of the cosine function in MATLAB using function “plot (f, t)”.
The function is found in part (b) is,
Program:
clc
clear
close all
t=1975:1:2004;
y=[16 13 28 93 155 155 140 116 67 46 18 13 29 100 158 ...
    143 146 94 55 30 18 9 21 64 93 119 111 104 64 40];
b=(1/2)*(max(y)+min(y));
a=(1/2)*(max(y)-min(y));
w=2*pi/30;
idx=find(y==max(y));
c=t(idx);
f=(a*cos(w*(t-c)))+b;
scatter(t,y,'linewidth',1.25');
hold on
plot(t,f,'linewidth',1.25');
set(gca,'Linewidth',1.2,'Fontsize',12);
xlabel('t (Month)');
ylabel('sunspots')
axis square
axis tight
Query:
- First, we have defined the given data sets.
- Then calculate the value of b, a, w, and c.
- Put all the values into the equation of cosine function and get the solution.
- Then sketch a graph.
d.
Calculate the sine function using given data set.
d.
Answer to Problem 9P
The cosine function is,
And the best fitting curve is,
Explanation of Solution
Given: A set of the data is,
Calculation:
First, we have to write a general equation of the cosine function,
Then, calculate the vertical shifting as,
Calculate the amplitude as,
Then, Calculate the phase shift as,
The value of c is,
Put all the value into the equation (1) then,
Program:
clc
clear
close all
t=1975:1:2004;
y=[16 13 28 93 155 155 140 116 67 46 18 13 29 100 158 ...
    143 146 94 55 30 18 9 21 64 93 119 111 104 64 40];
b=(1/2)*(max(y)+min(y));
a=(1/2)*(max(y)-min(y));
w=2*pi/30;
idx=find(y==max(y));
c=t(idx);
f=(a*sin(w*(t+c)))+b;
scatter(t,y,'linewidth',1.25');
hold on
plot(t,f,'linewidth',1.25');
set(gca,'Linewidth',1.2,'Fontsize',12);
xlabel('t (Month)');
ylabel('sunspots')
axis square
axis tight
Query:
- First, we have defined the given data sets.
- Then calculate the value of b, a, w, and c.
- Put all the values into the equation of cosine function and get the solution.
- Then sketch a best fitting curve with the scatter plot.
Chapter 5 Solutions
Precalculus: Mathematics for Calculus - 6th Edition


- 6. Solve the system of differential equations using Laplace Transforms: x(t) = 3x₁ (t) + 4x2(t) x(t) = -4x₁(t) + 3x2(t) x₁(0) = 1,x2(0) = 0arrow_forward3. Determine the Laplace Transform for the following functions. Show all of your work: 1-t, 0 ≤t<3 a. e(t) = t2, 3≤t<5 4, t≥ 5 b. f(t) = f(tt)e-3(-) cos 4τ drarrow_forward4. Find the inverse Laplace Transform Show all of your work: a. F(s) = = 2s-3 (s²-10s+61)(5-3) se-2s b. G(s) = (s+2)²arrow_forward
- 1. Consider the differential equation, show all of your work: dy =(y2)(y+1) dx a. Determine the equilibrium solutions for the differential equation. b. Where is the differential equation increasing or decreasing? c. Where are the changes in concavity? d. Suppose that y(0)=0, what is the value of y as t goes to infinity?arrow_forward2. Suppose a LC circuit has the following differential equation: q'+4q=6etcos 4t, q(0) = 1 a. Find the function for q(t), use any method that we have studied in the course. b. What is the transient and the steady-state of the circuit?arrow_forward5. Use variation of parameters to find the general solution to the differential equation: y" - 6y' + 9y=e3x Inxarrow_forward
- Let the region R be the area enclosed by the function f(x) = ln (x) + 2 and g(x) = x. Write an integral in terms of x and also an integral in terms of y that would represent the area of the region R. If necessary, round limit values to the nearest thousandth. 5 4 3 2 1 y x 1 2 3 4arrow_forward(28 points) Define T: [0,1] × [−,0] → R3 by T(y, 0) = (cos 0, y, sin 0). Let S be the half-cylinder surface traced out by T. (a) (4 points) Calculate the normal field for S determined by T.arrow_forward(14 points) Let S = {(x, y, z) | z = e−(x²+y²), x² + y² ≤ 1}. The surface is the graph of ze(+2) sitting over the unit disk. = (a) (4 points) What is the boundary OS? Explain briefly. (b) (4 points) Let F(x, y, z) = (e³+2 - 2y, xe³±² + y, e²+y). Calculate the curl V × F.arrow_forward
- (6 points) Let S be the surface z = 1 − x² - y², x² + y² ≤1. The boundary OS of S is the unit circle x² + y² = 1. Let F(x, y, z) = (x², y², z²). Use the Stokes' Theorem to calculate the line integral Hint: First calculate V x F. Jos F F.ds.arrow_forward(28 points) Define T: [0,1] × [−,0] → R3 by T(y, 0) = (cos 0, y, sin 0). Let S be the half-cylinder surface traced out by T. (a) (4 points) Calculate the normal field for S determined by T.arrow_forwardI need the last answer t=? I did got the answer for the first two this is just homework.arrow_forward
 Calculus: Early TranscendentalsCalculusISBN:9781285741550Author:James StewartPublisher:Cengage Learning
 Thomas' Calculus (14th Edition)CalculusISBN:9780134438986Author:Joel R. Hass, Christopher E. Heil, Maurice D. WeirPublisher:PEARSON
 Calculus: Early Transcendentals (3rd Edition)CalculusISBN:9780134763644Author:William L. Briggs, Lyle Cochran, Bernard Gillett, Eric SchulzPublisher:PEARSON
 Calculus: Early TranscendentalsCalculusISBN:9781319050740Author:Jon Rogawski, Colin Adams, Robert FranzosaPublisher:W. H. Freeman
 Calculus: Early Transcendental FunctionsCalculusISBN:9781337552516Author:Ron Larson, Bruce H. EdwardsPublisher:Cengage Learning