
Videos
a.
Sketch a
a.
Answer to Problem 8P
The scatter plot is
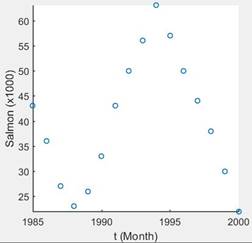
Explanation of Solution
Given: A set of the data is,
Calculation:
Let’s take a given data set sketch a scatter plot using MATLAB.
The function is using in the MATLAB to sketch a scatter plot is,
Program:
clc
clear
close all
t=[1985 1986 1987 1988 1989 1990 1991 1992 1993 1994 1995 1996 1997 1998 1999 2000];
y=[43 36 27 23 26 33 43 50 56 63 57 50 44 38 30 22];
scatter(t,y,'linewidth',1.25');
set(gca,'Linewidth',1.2,'Fontsize',12);
xlabel('t (Month)');
ylabel('Salmon (x1000)')
axis square
axis tight
Query:
- First, we have defined the given data sets.
- Then using a function “scatter (t, y)” sketch a scatter plot.
b.
Calculate the cosine function using given data set.
b.
Answer to Problem 8P
The cosine function is,
Explanation of Solution
Given: A set of the data is,
Calculation:
First, we have to write a general equation of the cosine function,
Then, calculate the vertical shifting as,
Calculate the amplitude as,
Then, Calculate the phase shift as,
The value of c is,
Put all the value into the equation (1) then,
Program:
clc
clear
close all
t=[1985 1986 1987 1988 1989 1990 1991 1992 1993 1994 1995 1996 1997 1998 1999 2000];
y=[43 36 27 23 26 33 43 50 56 63 57 50 44 38 30 22];
b=(1/2)*(max(y)+min(y));
a=(1/2)*(max(y)-min(y));
w=2*pi/16;
idx=find(y==max(y));
c=t(idx);
f=(a*cos(w*(t-c)))+b;
Query:
- First, we have defined the given data sets.
- Then calculate the value of b, a, w, and c.
- Put all the values into the equation of cosine function and get the solution.
c.
Sketch a graph of the function which is found in part (b).
c.
Answer to Problem 8P
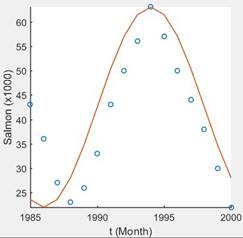
The solution is,
Explanation of Solution
Given: A set of the data is,
Calculation:
Sketch a graph of the cosine function in MATLAB using function “plot (f, t)”.
The function is found in part (b) is,
Program:
clc
clear
close all
t=[1985 1986 1987 1988 1989 1990 1991 1992 1993 1994 1995 1996 1997 1998 1999 2000];
y=[43 36 27 23 26 33 43 50 56 63 57 50 44 38 30 22];
b=(1/2)*(max(y)+min(y));
a=(1/2)*(max(y)-min(y));
w=2*pi/16;
idx=find(y==max(y));
c=t(idx);
f=(a*cos(w*(t-c)))+b;
scatter(t,y,'linewidth',1.25');
hold on
plot(t,f,'linewidth',1.25');
set(gca,'Linewidth',1.2,'Fontsize',12);
xlabel('t (Month)');
ylabel('Salmon (x1000)')
axis square
axis tight
Query:
- First, we have defined the given data sets.
- Then calculate the value of b, a, w, and c.
- Put all the values into the equation of cosine function and get the solution.
- Then sketch a graph.
d.
Calculate the sine function using given data set.
d.
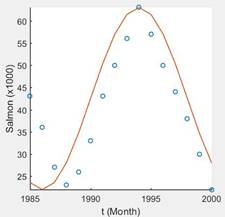
Answer to Problem 8P
The cosine function is,
And the best fitting curve is,
Explanation of Solution
Given: A set of the data is,
Calculation:
First, we have to write a general equation of the cosine function,
Then, calculate the vertical shifting as,
Calculate the amplitude as,
Then, Calculate the phase shift as,
The value of c is,
Put all the value into the equation (1) then,
Program:
clc
clear
close all
t=[1 2 3 4 5 6 7 8 9 10 11 12];
y=[40.0 43.1 54.6 64.2 73.8 81.8 85.8 83.9 76.9 66.8 55.5 44.5];
b=(1/2)*(max(y)+min(y));
a=(1/2)*(max(y)-min(y));
w=2*pi/max(t);
idx=find(y==max(y));
c=t(idx);
f=(a*sin(w*(t+c)))+b;
scatter(t,y,'linewidth',1.25');
hold on
plot(t,f,'linewidth',1.25');
set(gca,'Linewidth',1.2,'Fontsize',12);
xlabel('t (Month)');
ylabel('Average temperature (^{\circ}F)')
axis square
axis tight
Query:
- First, we have defined the given data sets.
- Then calculate the value of b, a, w, and c.
- Put all the values into the equation of cosine function and get the solution.
- Then sketch a best fitting curve with the scatter plot.
Chapter 5 Solutions
Precalculus: Mathematics for Calculus - 6th Edition


- Can you answer this question and give step by step and why and how to get it. Can you write it (numerical method)arrow_forwardCan you answer this question and give step by step and why and how to get it. Can you write it (numerical method)arrow_forwardThere are three options for investing $1150. The first earns 10% compounded annually, the second earns 10% compounded quarterly, and the third earns 10% compounded continuously. Find equations that model each investment growth and use a graphing utility to graph each model in the same viewing window over a 20-year period. Use the graph to determine which investment yields the highest return after 20 years. What are the differences in earnings among the three investment? STEP 1: The formula for compound interest is A = nt = P(1 + − − ) n², where n is the number of compoundings per year, t is the number of years, r is the interest rate, P is the principal, and A is the amount (balance) after t years. For continuous compounding, the formula reduces to A = Pert Find r and n for each model, and use these values to write A in terms of t for each case. Annual Model r=0.10 A = Y(t) = 1150 (1.10)* n = 1 Quarterly Model r = 0.10 n = 4 A = Q(t) = 1150(1.025) 4t Continuous Model r=0.10 A = C(t) =…arrow_forward
- Use a graphing utility to find the point of intersection, if any, of the graphs of the functions. Round your result to three decimal places. (Enter NONE in any unused answer blanks.) y = 100e0.01x (x, y) = y = 11,250 ×arrow_forward5. For the function y-x³-3x²-1, use derivatives to: (a) determine the intervals of increase and decrease. (b) determine the local (relative) maxima and minima. (e) determine the intervals of concavity. (d) determine the points of inflection. (e) sketch the graph with the above information indicated on the graph.arrow_forwardCan you solve this 2 question numerical methodarrow_forward
- 1. Estimate the area under the graph of f(x)-25-x from x=0 to x=5 using 5 approximating rectangles Using: (A) right endpoints. (B) left endpoints.arrow_forward9. Use fundamental theorem of calculus to find the derivative d a) *dt sin(x) b)(x)√1-2 dtarrow_forward3. Evaluate the definite integral: a) √66x²+8dx b) x dx c) f*(2e* - 2)dx d) √√9-x² e) (2-5x)dx f) cos(x)dx 8)²₁₂√4-x2 h) f7dx i) f² 6xdx j) ²₂(4x+3)dxarrow_forward
 Calculus: Early TranscendentalsCalculusISBN:9781285741550Author:James StewartPublisher:Cengage Learning
 Thomas' Calculus (14th Edition)CalculusISBN:9780134438986Author:Joel R. Hass, Christopher E. Heil, Maurice D. WeirPublisher:PEARSON
 Calculus: Early Transcendentals (3rd Edition)CalculusISBN:9780134763644Author:William L. Briggs, Lyle Cochran, Bernard Gillett, Eric SchulzPublisher:PEARSON
 Calculus: Early TranscendentalsCalculusISBN:9781319050740Author:Jon Rogawski, Colin Adams, Robert FranzosaPublisher:W. H. Freeman
 Calculus: Early Transcendental FunctionsCalculusISBN:9781337552516Author:Ron Larson, Bruce H. EdwardsPublisher:Cengage Learning