Videos
a.
Sketch a
a.
Answer to Problem 2P
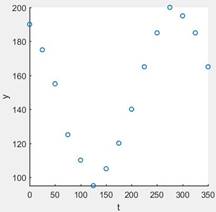
The scatter plot is
Explanation of Solution
Given: A set of the data is,
Calculation:
Let’s take a given data set sketch a scatter plot using MATLAB.
The function is using in the MATLAB to sketch a scatter plot is,
Program:
clc
clear
close all
t=[0 25 50 75 100 125 150 175 200 225 250 275 300 325 350];
y=[190 175 155 125 110 95 105 120 140 165 185 200 195 185 165];
scatter(t,y,'linewidth',1.25');
set(gca,'Linewidth',1.2,'Fontsize',12);
xlabel('t');
ylabel('y')
axis square
axis tight
Query:
- First, we have defined the given data sets.
- Then using a function “scatter (t, y)” sketch a scatter plot.
b.
Calculate the cosine function using given data set.
b.
Answer to Problem 2P
The cosine function is,
Explanation of Solution
Given: A set of the data is,
Calculation:
First, we have to write a general equation of the cosine function,
Then, calculate the vertical shifting as,
Calculate the amplitude as,
Then, Calculate the phase shift as,
The value of c is,
Put all the value into the equation (1) then,
Program:
clc
clear
close all
t=[0 25 50 75 100 125 150 175 200 225 250 275 300 325 350];
y=[190 175 155 125 110 95 105 120 140 165 185 200 195 185 165];
b=(1/2)*(max(y)+min(y));
a=(1/2)*(max(y)-min(y));
w=2*pi/max(t);
idx=find(y==max(y));
c=t(idx);
f=(a*cos(w*(t-c)))+b;
scatter(t,y,'linewidth',1.25');
set(gca,'Linewidth',1.2,'Fontsize',12);
xlabel('t');
ylabel('y')
axis square
axis tight
Query:
- First, we have defined the given data sets.
- Then calculate the value of b, a, w, and c.
- Put all the values into the equation of cosine function and get the solution.
c.
Sketch a graph of the function which is found in part (b).
c.
Answer to Problem 2P
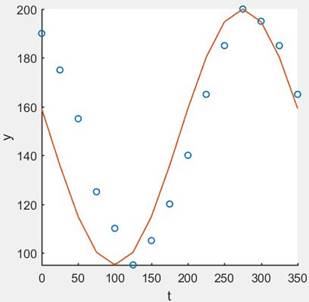
The solution is,
Explanation of Solution
Given: A set of the data is,
Calculation:
Sketch a graph of the cosine function in MATLAB using function “plot (f, t)”.
The function is found in part (b) is,
Program:
clc
clear
close all
t=[0 25 50 75 100 125 150 175 200 225 250 275 300 325 350];
y=[190 175 155 125 110 95 105 120 140 165 185 200 195 185 165];
b=(1/2)*(max(y)+min(y));
a=(1/2)*(max(y)-min(y));
w=2*pi/max(t);
idx=find(y==max(y));
c=t(idx);
f=(a*cos(w*(t-c)))+b;
scatter(t,y,'linewidth',1.25');
hold on
plot(t,f,'linewidth',1.25');
set(gca,'Linewidth',1.2,'Fontsize',12);
xlabel('t');
ylabel('y')
axis square
axis tight
Query:
- First, we have defined the given data sets.
- Then calculate the value of b, a, w, and c.
- Put all the values into the equation of cosine function and get the solution.
- Then sketch a graph.
d.
Calculate the sine function using given data set.
d.
Answer to Problem 2P
The cosine function is,
Explanation of Solution
Given: A set of the data is,
Calculation:
First, we have to write a general equation of the cosine function,
Then, calculate the vertical shifting as,
Calculate the amplitude as,
Then, Calculate the phase shift as,
The value of c is,
Put all the value into the equation (1) then,
Program:
clc
clear
close all
t=[0 25 50 75 100 125 150 175 200 225 250 275 300 325 350];
y=[190 175 155 125 110 95 105 120 140 165 185 200 195 185 165];
b=(1/2)*(max(y)+min(y));
a=(1/2)*(max(y)-min(y));
w=2*pi/max(t);
idx=find(y==max(y));
c=t(idx);
f=(a*sin(w*(t+c)))+b;
Query:
- First, we have defined the given data sets.
- Then calculate the value of b, a, w, and c.
- Put all the values into the equation of cosine function and get the solution.
e.
Compare the results from part (b) and (c).
e.
Answer to Problem 2P
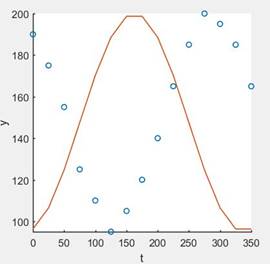
Using reduction relation, the graph of the given data is,
Explanation of Solution
Given: the reduction formula,
Calculation:
As we can see in part (d) the sine function is,
Where,
Then rewrite the function as,
Simplify the above function and sketch a graph.
Program:
clc
clear
close all
t=[0 25 50 75 100 125 150 175 200 225 250 275 300 325 350];
y=[190 175 155 125 110 95 105 120 140 165 185 200 195 185 165];
b=(1/2)*(max(y)+min(y));
a=(1/2)*(max(y)-min(y));
w=2*pi/max(t);
idx=find(y==max(y));
c=t(idx);
f=(a*cos(w*(t+c)-pi/2))+b;
scatter(t,y,'linewidth',1.25');
hold on
plot(t,f,'linewidth',1.25');
set(gca,'linewidth',1.2,'fontsize',12);
xlabel('t');
ylabel('y')
axis square
axis tight
Query:
- First, we have defined the given data sets.
- Then calculate the value of b, a, w, and c.
- Then using reduction relation redefine the function.
- Sketch a graph.
Chapter 5 Solutions
Precalculus: Mathematics for Calculus - 6th Edition


- Force with 800 N and 400 N are acting on a machine part at 30° and 60°, respectively with the positive x axisarrow_forwardFind the accumulated amount A, if the principal P is invested at an interest rate of r per year for t years. (Round your answer to the nearest cent.) P = $13,000, r = 6%, t = 10, compounded quarterly A = $ 31902 Need Help? Read It Watch It Viewing Saved Work Revert to Last Response SUBMIT ANSWER O/6.66 Points] DETAILS MY NOTES TANAPCALC10 5.3.003. EVIOUS ANSWERS ASK YOUR TEACHER PRACTICE ANOTHER Find the accumulated amount A, if the principal P is invested at an interest rate of r per year for t years. (Round your answer to the nearest cent.) P = $140,000, r = 8%, t = 8, compounded monthly A = $259130.20 X Need Help? Read It Watch Itarrow_forwardFind the present value of $20,000 due in 3 years at the given rate of interest. (Round your answers to the nearest cent.) (a) 2%/year compounded monthly (b) 5%/year compounded daily $ Need Help? Read It Watch It SUBMIT ANSWER [-/6.66 Points] DETAILS MY NOTES TANAPCALC10 5.3.009. ASK YOUR TEACHER PRACTICE ANC Find the accumulated amount after 3 years if $4000 is invested at 3%/year compounded continuously. (Round your answer to the nearest cent.) Need Help? Read It Watch Itarrow_forward
- Find the effective rate corresponding to the given nominal rate. (Round your answers to three decimal places.) (a) 9.5%/year compounded monthly % (b) 9.5%/year compounded daily % Need Help? Read It Watch It SUBMIT ANSWER -/6.66 Points] DETAILS MY NOTES TANAPCALC10 5.3.007. ASK YOUR TEACHE Find the present value of $90,000 due in 7 years at the given rate of interest. (Round your answers to the nearest cent.) (a) 9%/year compounded semiannually (b) 9%/year compounded quarterly LAarrow_forwardFind the accumulated amount A, if the principal P is invested at an interest rate of r per year for t years. (Round your answer to the nearest cent.) P = $160,000, r = 7%, t = 4, compounded daily A = $211113.60 Need Help? Read It SUBMIT ANSWER ASK YOUR TEACHER PRACTICE ANOTHER --/6.66 Points] DETAILS MY NOTES TANAPCALC10 5.3.005. Find the effective rate corresponding to the given nominal rate. (Round your answers to three decimal places.) (a) 8%/year compounded semiannually % (b) 9%/year compounded quarterly %arrow_forwardFind the derivative of the function. g'(t) = 9t g(t) = In(t) (9ln(t) - 1) [In(t)] 2 × Need Help? Read It Watch Itarrow_forward
- Find the accumulated amount A, if the principal P is invested at an interest rate of r per year for t years. (Round your answer to the nearest cent.) P = $3800, r = 4%, t = 10, compounded semiannually A = $ 5645.60 × Need Help? Read It SUBMIT ANSWER [3.33/6.66 Points] DETAILS MY NOTES REVIOUS ANSWERS ASK YOUR TEACHER TANAPCALC10 5.3.001.EP. PRACTICE ANOTHER Consider the following where the principal P is invested at an interest rate of r per year for t years. P = $3,100, r = 4%, t = 10, compounded semiannually Determine m, the number of conversion periods per year. 2 Find the accumulated amount A (in dollars). (Round your answer to the nearest cent.) A = $ 4604.44arrow_forwardForce with 800 N and 400 N are acting on a machine part at 30° and 60°, respectively with a positive x axis, Draw the diagram representing this situationarrow_forwardI forgot to mention to you to solve question 1 and 2. Can you solve it using all data that given in the pict i given and can you teach me about that.arrow_forward
 Calculus: Early TranscendentalsCalculusISBN:9781285741550Author:James StewartPublisher:Cengage Learning
 Thomas' Calculus (14th Edition)CalculusISBN:9780134438986Author:Joel R. Hass, Christopher E. Heil, Maurice D. WeirPublisher:PEARSON
 Calculus: Early Transcendentals (3rd Edition)CalculusISBN:9780134763644Author:William L. Briggs, Lyle Cochran, Bernard Gillett, Eric SchulzPublisher:PEARSON
 Calculus: Early TranscendentalsCalculusISBN:9781319050740Author:Jon Rogawski, Colin Adams, Robert FranzosaPublisher:W. H. Freeman
 Calculus: Early Transcendental FunctionsCalculusISBN:9781337552516Author:Ron Larson, Bruce H. EdwardsPublisher:Cengage Learning