Concept explainers
Videos
a.
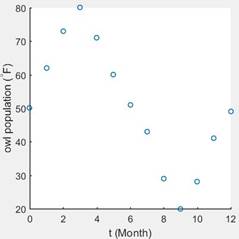
Sketch a
a.
Answer to Problem 7P
The scatter plot is
Explanation of Solution
Given: A set of the data is,
Calculation:
Let’s take a given data set sketch a scatter plot using MATLAB.
The function is using in the MATLAB to sketch a scatter plot is,
Program:
clc
clear
close all
t=[1 2 3 4 5 6 7 8 9 10 11 12];
y=[40.0 43.1 54.6 64.2 73.8 81.8 85.8 83.9 76.9 66.8 55.5 44.5];
scatter(t,y,'linewidth',1.25');
set(gca,'Linewidth',1.2,'Fontsize',12);
xlabel('t (Month)');
ylabel('Average temperature (^{\circ}F)')
axis square
axis tight
Query:
- First, we have defined the given data sets.
- Then using a function “scatter (t, y)” sketch a scatter plot.
b.
Calculate the cosine function using given data set.
b.
Answer to Problem 7P
The cosine function is,
Explanation of Solution
Given: A set of the data is,
Calculation:
First, we have to write a general equation of the cosine function,
Then, calculate the vertical shifting as,
Calculate the amplitude as,
Then, Calculate the phase shift as,
The value of c is,
Put all the value into the equation (1) then,
Program:
clc
clear
close all
t=[0 1 2 3 4 5 6 7 8 9 10 11 12];
y=[50 62 73 80 71 60 51 43 29 20 28 41 49];
b=(1/2)*(max(y)+min(y));
a=(1/2)*(max(y)-min(y));
w=2*pi/max(t);
idx=find(y==max(y));
c=t(idx);
f=(a*cos(w*(t-c)))+b;
Query:
- First, we have defined the given data sets.
- Then calculate the value of b, a, w, and c.
- Put all the values into the equation of cosine function and get the solution.
c.
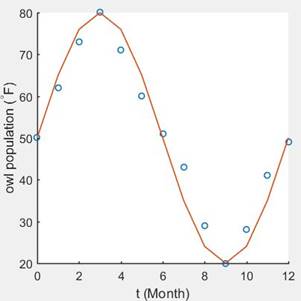
Sketch a graph of the function which is found in part (b).
c.
Answer to Problem 7P
The solution is,
Explanation of Solution
Given: A set of the data is,
Calculation:
Sketch a graph of the cosine function in MATLAB using function “plot (f, t)”.
The function is found in part (b) is,
Program:
clc
clear
close all
t=[1 2 3 4 5 6 7 8 9 10 11 12];
y=[40.0 43.1 54.6 64.2 73.8 81.8 85.8 83.9 76.9 66.8 55.5 44.5];
b=(1/2)*(max(y)+min(y));
a=(1/2)*(max(y)-min(y));
w=2*pi/max(t);
idx=find(y==max(y));
c=t(idx);
f=(a*cos(w*(t-c)))+b;
scatter(t,y,'linewidth',1.25');
hold on
plot(t,f,'linewidth',1.25');
set(gca,'Linewidth',1.2,'Fontsize',12);
xlabel('t (Month)');
ylabel('Average temperature (^{\circ}F)')
axis square
axis tight
Query:
- First, we have defined the given data sets.
- Then calculate the value of b, a, w, and c.
- Put all the values into the equation of cosine function and get the solution.
- Then sketch a graph.
d.
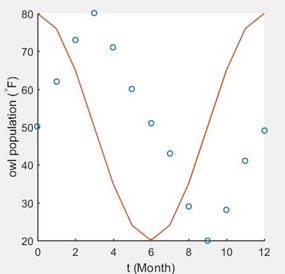
Calculate the sine function using given data set.
d.
Answer to Problem 7P
The cosine function is,
And the best fitting curve is,
Explanation of Solution
Given: A set of the data is,
Calculation:
First, we have to write a general equation of the cosine function,
Then, calculate the vertical shifting as,
Calculate the amplitude as,
Then, Calculate the phase shift as,
The value of c is,
Put all the value into the equation (1) then,
Program:
clc
clear
close all
t=[1 2 3 4 5 6 7 8 9 10 11 12];
y=[40.0 43.1 54.6 64.2 73.8 81.8 85.8 83.9 76.9 66.8 55.5 44.5];
b=(1/2)*(max(y)+min(y));
a=(1/2)*(max(y)-min(y));
w=2*pi/max(t);
idx=find(y==max(y));
c=t(idx);
f=(a*sin(w*(t+c)))+b;
scatter(t,y,'linewidth',1.25');
hold on
plot(t,f,'linewidth',1.25');
set(gca,'Linewidth',1.2,'Fontsize',12);
xlabel('t (Month)');
ylabel('Average temperature (^{\circ}F)')
axis square
axis tight
Query:
- First, we have defined the given data sets.
- Then calculate the value of b, a, w, and c.
- Put all the values into the equation of cosine function and get the solution.
- Then sketch a best fitting curve with the scatter plot.
Chapter 5 Solutions
Precalculus: Mathematics for Calculus - 6th Edition


- For the curve defined by r(t) = (e** cos(t), et sin(t)) find the unit tangent vector, unit normal vector, normal acceleration, and tangential acceleration at t = πT 3 T (1) N Ň (1) 133 | aN = 53 ar = = =arrow_forwardFind the tangential and normal components of the acceleration vector for the curve - F(t) = (2t, −3t³, −3+¹) at the point t = 1 - ā(1) = T + Ñ Give your answers to two decimal placesarrow_forwardFind the unit tangent vector to the curve defined by (t)=(-2t,-4t, √√49 - t²) at t = −6. T(−6) =arrow_forward
- An airplane flies due west at an airspeed of 428 mph. The wind blows in the direction of 41° south of west at 50 mph. What is the ground speed of the airplane? What is the bearing of the airplane? 428 mph 41° 50 mph a. The ground speed of the airplane is b. The bearing of the airplane is mph. south of west.arrow_forwardRylee's car is stuck in the mud. Roman and Shanice come along in a truck to help pull her out. They attach one end of a tow strap to the front of the car and the other end to the truck's trailer hitch, and the truck starts to pull. Meanwhile, Roman and Shanice get behind the car and push. The truck generates a horizontal force of 377 lb on the car. Roman and Shanice are pushing at a slight upward angle and generate a force of 119 lb on the car. These forces can be represented by vectors, as shown in the figure below. The angle between these vectors is 20.2°. Find the resultant force (the vector sum), then give its magnitude and its direction angle from the positive x-axis. 119 lb 20.2° 377 lb a. The resultant force is (Tip: omit degree notations from your answers; e.g. enter cos(45) instead of cos(45°)) b. It's magnitude is lb. c. It's angle from the positive x-axis isarrow_forwardFind a plane containing the point (3, -3, 1) and the line of intersection of the planes 2x + 3y - 3z = 14 and -3x - y + z = −21. The equation of the plane is:arrow_forward
- Determine whether the lines L₁ : F(t) = (−2, 3, −1)t + (0,2,-3) and L2 : ƒ(s) = (2, −3, 1)s + (−10, 17, -8) intersect. If they do, find the point of intersection. ● They intersect at the point They are skew lines They are parallel or equalarrow_forwardAnswer questions 2arrow_forwardHow does a fourier transform works?arrow_forward
- Determine the radius of convergence of a power series:12.6.5, 12.6.6, 12.6.7, 12.6.8Hint: Use Theorem12.5.1 and root test, ratio test, integral testarrow_forwardCan you answer this question and give step by step and why and how to get it. Can you write it (numerical method)arrow_forwardCan you answer this question and give step by step and why and how to get it. Can you write it (numerical method)arrow_forward
 Calculus: Early TranscendentalsCalculusISBN:9781285741550Author:James StewartPublisher:Cengage Learning
 Thomas' Calculus (14th Edition)CalculusISBN:9780134438986Author:Joel R. Hass, Christopher E. Heil, Maurice D. WeirPublisher:PEARSON
 Calculus: Early Transcendentals (3rd Edition)CalculusISBN:9780134763644Author:William L. Briggs, Lyle Cochran, Bernard Gillett, Eric SchulzPublisher:PEARSON
 Calculus: Early TranscendentalsCalculusISBN:9781319050740Author:Jon Rogawski, Colin Adams, Robert FranzosaPublisher:W. H. Freeman
 Calculus: Early Transcendental FunctionsCalculusISBN:9781337552516Author:Ron Larson, Bruce H. EdwardsPublisher:Cengage Learning