
Concept explainers
Videos
The accompanying data represent x = Amount of catalyst added to accelerate a chemical reaction and y = Reaction time:
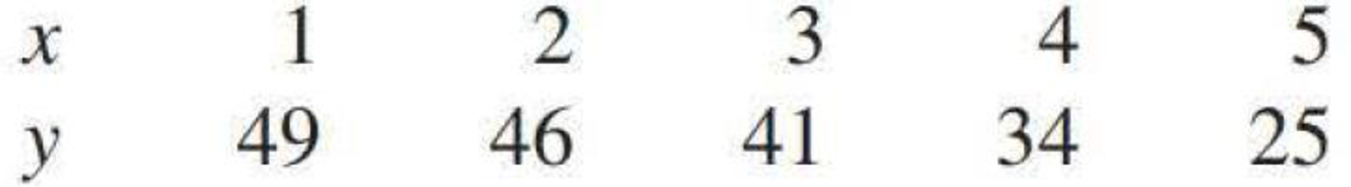
- a. Calculate the value of the
correlation coefficient , r. Does the value of r suggest a strong linear relationship? - b. Construct a
scatterplot . From the plot, does the word linear provide the most effective description of the relationship between x and y? Explain.
a.
Find the correlation coefficient.
Explain whether the correlation coefficient suggest a strong relation or not.
Answer to Problem 55CR
The correlation coefficient is –0.981.
Explanation of Solution
Calculation:
The given data relates to the amount of catalyst added in a chemical reaction, x and the reaction time, y. The correlation coefficient is denoted by r.
Correlation coefficient:
Software procedure:
Step by step procedure to obtain the correlation coefficient using the MINITAB software:
- Choose Stat > Basic Statistics > Correlation.
- Enter the columns of x, y under Variables.
- Click OK in all dialogue boxes.
Output obtained using MINITAB is given below:
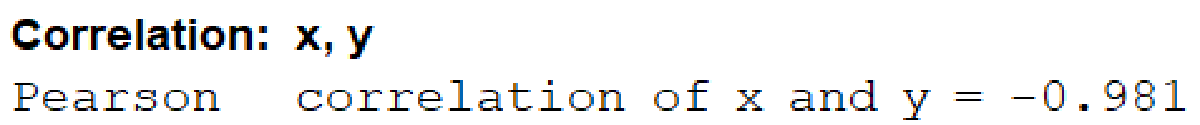
Thus, from the output, the correlation coefficient is –0.981.
Interpretation:
A value of the correlation coefficient, r closer to 1 or –1 suggests a strong correlation coefficient, whereas a value closer to 0 suggests a weak correlation coefficient.
Here, the correlation coefficient is –0.981, which is very close to –1. Evidently, the negative sign suggests a negative relationship between the variables, so that, higher values of x are associated to lower values of y.
Thus, the relationship between x and y is a very strong negative linear relationship.
b.
Draw a scatterplot of the data set.
Explain whether it is appropriate to describe the relationship between x and y as linear.
Answer to Problem 55CR
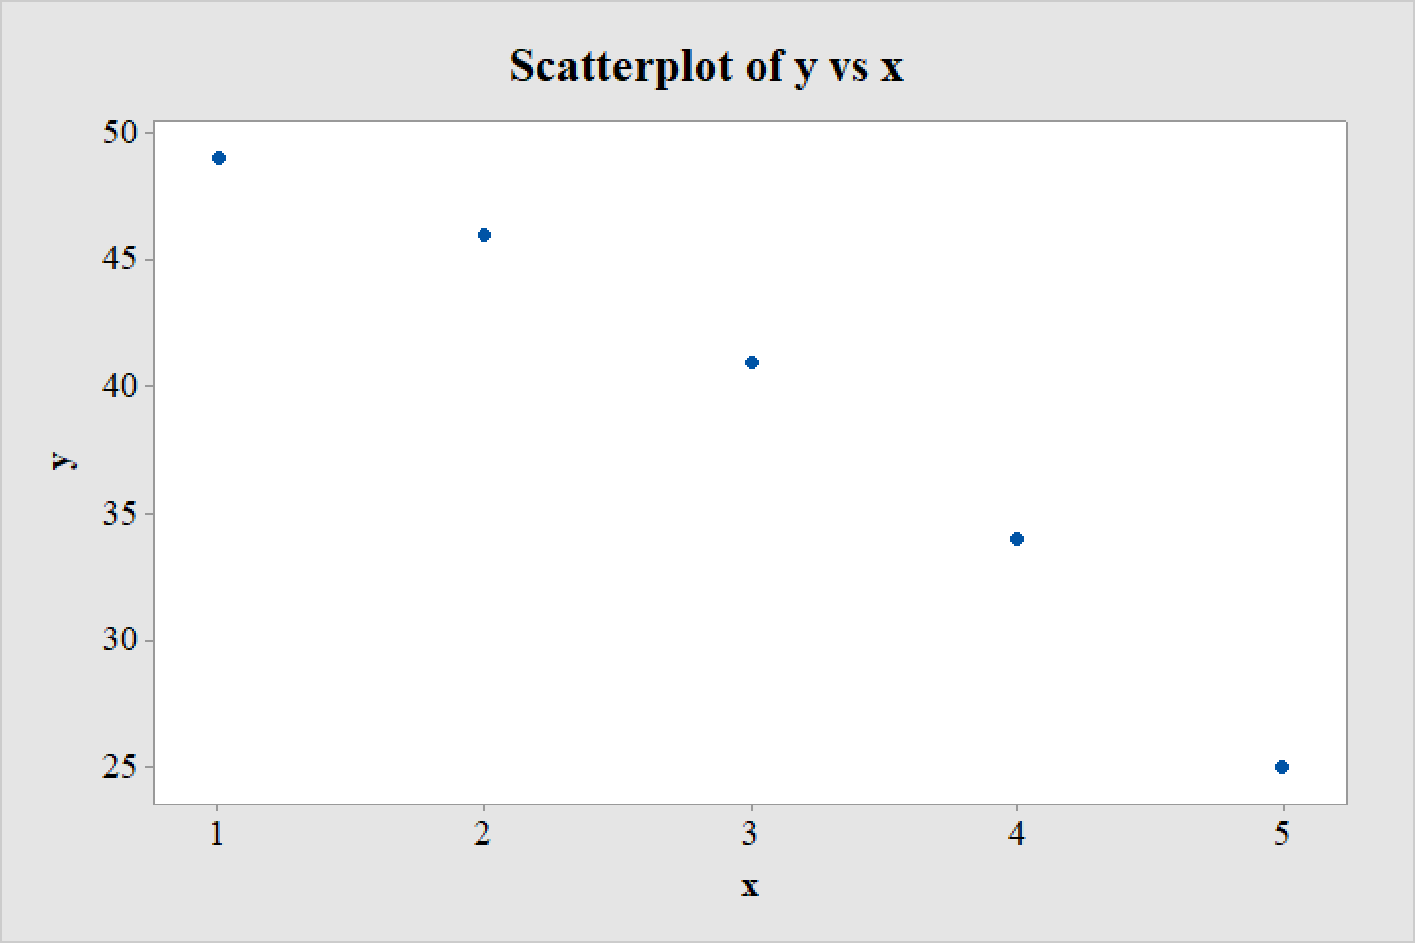
The scatterplot of the data set is as follows:
Explanation of Solution
Calculation:
Scatterplot:
Software procedure:
Step by step procedure to draw the scatterplot using the MINITAB software:
- Choose Graph > Scatterplot > Simple > OK.
- Enter the column of y under Y-variables.
- Enter the column of x under X-variables.
- Click OK in all dialogue boxes.
Thus, the scatterplot is obtained.
Interpretation:
A careful observation of the scatterplot reveals that the points do not exactly fall on a straight line. Rather, the points appear to form a curve with a wide arc.
Hence, it is not appropriate to describe the relationship between x and y as linear.
The arc of the curve being very wide, none of the points would fall to far away from a line drawn through the plot. As a result, the correlation coefficient in Part a has a very high negative value.
Want to see more full solutions like this?
Chapter 5 Solutions
Introduction to Statistics and Data Analysis
Additional Math Textbook Solutions
Mathematics for the Trades: A Guided Approach (11th Edition) (What's New in Trade Math)
Finite Mathematics for Business, Economics, Life Sciences and Social Sciences
Elementary Algebra For College Students (10th Edition)
Elementary Statistics: Picturing the World (7th Edition)
Calculus: Early Transcendentals (2nd Edition)
Elementary and Intermediate Algebra: Concepts and Applications (7th Edition)


- y of 45 home- televisions u find that 010020 le own one, ee, and 1 owns y histogram of 4 Suppose that you have a loaded die. You roll it several times and record the outcomes, which are shown in the following figure. Histogram for Loaded Die 444% 34.00 48% 6% 2% Frequency 20 20 15 155 10 5- ம 0 1 2 3 4 Outcome 5 6 a. Make a relative frequency histogram of these results. b. You can make a relative frequency histo- gram from a frequency histogram; can you go the other direction?arrow_forwardCalculate the mean for Study Hours and Test Scores. Compute the covariance between the two variables using the formula: Calculate the standard deviation for Study Hours (X) and Test Scores (Y). Determine the correlation coefficient Interpret the results: What does the calculated r-value indicate about the relationship between study hours and test scores?arrow_forwardFor unemployed persons in the United States, the average number of months of unemployment at the end of December 2009 was approximately seven months (Bureau of Labor Statistics, January 2010). Suppose the following data are for a particular region in upstate New York. The values in the first column show the number of months unemployed and the values in the second column show the corresponding number of unemployed persons. Months Unemployed Number Unemployed 1 1029 2 1686 3 2269 4 2675 5 3487 6 4652 7 4145 8 3587 9 2325 10 1120 Let x be a random variable indicating the number of months a person is unemployed. a. Use the data to develop an empirical discrete probability distribution for x (to 4 decimals). (x) f(x) 1 2 3 4 5 6 7 8 9 10 b. Show that your probability distribution satisfies the conditions for a valid discrete probability distribution. The input in the box below will not be graded, but may be reviewed and considered by your instructor. blank c. What is the probability that a…arrow_forward
- West Virginia has one of the highest divorce rates in the nation, with an annual rate of approximately 5 divorces per 1000 people (Centers for Disease Control and Prevention website, January 12, 2012). The Marital Counseling Center, Inc. (MCC) thinks that the high divorce rate in the state may require them to hire additional staff. Working with a consultant, the management of MCC has developed the following probability distribution for x = the number of new clients for marriage counseling for the next year. Excel File: data05-19.xls x 10 f(x) .05 20 30 .10 .10 40 .20 50 60 .35 .20 a. Is this probability distribution valid? - Select your answer- Explain. f(x) Σf(x) Select your answer Select your answer b. What is the probability MCC will obtain more than 30 new clients (to 2 decimals)? c. What is the probability MCC will obtain fewer than 20 new clients (to 2 decimals)? d. Compute the expected value and variance of x. Expected value Variance clients per year squared clients per yeararrow_forwardFor unemployed persons in the United States, the average number of months of unemployment at the end of December 2009 was approximately seven months (Bureau of Labor Statistics, January 2010). Suppose the following data are for a particular region in upstate New York. The values in the first column show the number of months unemployed and the values in the second column show the corresponding number of unemployed persons. Months Unemployed Number Unemployed 1 1029 2 1686 3 2269 4 2675 5 3487 6 4652 7 4145 8 3587 9 2325 10 1120 Let x be a random variable indicating the number of months a person is unemployed. a. Use the data to develop an empirical discrete probability distribution for x (to 4 decimals). (x) f(x) 1 2 3 4 5 6 7 8 9 10 b. Show that your probability distribution satisfies the conditions for a valid discrete probability distribution. The input in the box below will not be graded, but may be reviewed and considered by your instructor. c. What is the probability that a person…arrow_forwardIn Gallup's Annual Consumption Habits Poll, telephone interviews were conducted for a random sample of 1014 adults aged 18 and over. One of the questions was "How many cups of coffee, if any, do you drink on an average day?" The following table shows the results obtained (Gallup website, August 6, 2012). Excel File: data05-23.xls Number of Cups per Day Number of Responses 0 365 264 193 3 4 or more 91 101 Define a random variable x = number of cups of coffee consumed on an average day. Let x = 4 represent four or more cups. Round your answers to four decimal places. a. Develop a probability distribution for x. x 0 1 2 3 4 f(x) b. Compute the expected value of x. cups of coffee c. Compute the variance of x. cups of coffee squared d. Suppose we are only interested in adults that drink at least one cup of coffee on an average day. For this group, let y = the number of cups of coffee consumed on an average day. Compute the expected value of y. Compare it to the expected value of x. The…arrow_forward
- In Gallup's Annual Consumption Habits Poll, telephone interviews were conducted for a random sample of 1014 adults aged 18 and over. One of the questions was "How many cups of coffee, if any, do you drink on an average day?" The following table shows the results obtained (Gallup website, August 6, 2012). Excel File: data05-23.xls Number of Cups per Day Number of Responses 0 365 264 193 2 3 4 or more 91 101 Define a random variable x = number of cups of coffee consumed on an average day. Let x = 4 represent four or more cups. Round your answers to four decimal places. a. Develop a probability distribution for x. x 0 1 2 3 f(x) b. Compute the expected value of x. cups of coffee c. Compute the variance of x. cups of coffee squared d. Suppose we are only interested in adults that drink at least one cup of coffee on an average day. For this group, let y = the number of cups of coffee consumed on an average day. Compute the expected value of y. Compare it to the expected value of x. The…arrow_forwardA technician services mailing machines at companies in the Phoenix area. Depending on the type of malfunction, the service call can take 1, 2, 3, or 4 hours. The different types of malfunctions occur at about the same frequency. Develop a probability distribution for the duration of a service call. Duration of Call x f(x) 1 2 3 4 Which of the following probability distribution graphs accurately represents the data set? Consider the required conditions for a discrete probability function, shown below.Does this probability distribution satisfy equation (5.1)?Does this probability distribution satisfy equation (5.2)? What is the probability a service call will take three hours? A service call has just come in, but the type of malfunction is unknown. It is 3:00 P.M. and service technicians usually get off at 5:00 P.M. What is the probability the service technician will have to work overtime to fix the machine today?arrow_forwardA psychologist determined that the number of sessions required to obtain the trust of a new patient is either 1, 2, or 3. Let x be a random variable indicating the number of sessions required to gain the patient's trust. The following probability function has been proposed. x f(x) for x = 1, 2, or 3 a. Consider the required conditions for a discrete probability function, shown below. f(x) ≥0 Σf(x) = 1 (5.1) (5.2) Does this probability distribution satisfy equation (5.1)? Select Does this probability distribution satisfy equation (5.2)? Select b. What is the probability that it takes exactly 2 sessions to gain the patient's trust (to 3 decimals)? c. What is the probability that it takes at least 2 sessions to gain the patient's trust (to 3 decimals)?arrow_forward
- A technician services mailing machines at companies in the Phoenix area. Depending on the type of malfunction, the service call can take 1, 2, 3, or 4 hours. The different types of malfunctions occur at about the same frequency. Develop a probability distribution for the duration of a service call. Which of the following probability distribution graphs accurately represents the data set? Consider the required conditions for a discrete probability function, shown below.Does this probability distribution satisfy equation (5.1)?Does this probability distribution satisfy equation (5.2)? What is the probability a service call will take three hours? A service call has just come in, but the type of malfunction is unknown. It is 3:00 P.M. and service technicians usually get off at 5:00 P.M. What is the probability the service technician will have to work overtime to fix the machine today?arrow_forwardWest Virginia has one of the highest divorce rates in the nation, with an annual rate of approximately 5 divorces per 1000 people (Centers for Disease Control and Prevention website, January 12, 2012). The Marital Counseling Center, Inc. (MCC) thinks that the high divorce rate in the state may require them to hire additional staff. Working with a consultant, the management of MCC has developed the following probability distribution for x = the number of new clients for marriage counseling for the next year. Excel File: data05-19.xls 10 20 f(x) .05 .10 11 30 40 50 60 .10 .20 .35 .20 a. Is this probability distribution valid? Yes Explain. greater than or equal to 0 f(x) Σf(x) equal to 1 b. What is the probability MCC will obtain more than 30 new clients (to 2 decimals)? c. What is the probability MCC will obtain fewer than 20 new clients (to 2 decimals)? d. Compute the expected value and variance of x. Expected value Variance clients per year squared clients per yeararrow_forwardReconsider the patient satisfaction data in Table 1. Fit a multiple regression model using both patient age and severity as the regressors. (a) Test for significance of regression. (b) Test for the individual contribution of the two regressors. Are both regressor variables needed in the model? (c) Has adding severity to the model improved the quality of the model fit? Explain your answer.arrow_forward
 Glencoe Algebra 1, Student Edition, 9780079039897...AlgebraISBN:9780079039897Author:CarterPublisher:McGraw Hill
 Big Ideas Math A Bridge To Success Algebra 1: Stu...AlgebraISBN:9781680331141Author:HOUGHTON MIFFLIN HARCOURTPublisher:Houghton Mifflin Harcourt
 Algebra & Trigonometry with Analytic GeometryAlgebraISBN:9781133382119Author:SwokowskiPublisher:Cengage
 Functions and Change: A Modeling Approach to Coll...AlgebraISBN:9781337111348Author:Bruce Crauder, Benny Evans, Alan NoellPublisher:Cengage Learning
 Holt Mcdougal Larson Pre-algebra: Student Edition...AlgebraISBN:9780547587776Author:HOLT MCDOUGALPublisher:HOLT MCDOUGAL