
Introduction to Statistics and Data Analysis
5th Edition
ISBN: 9781305115347
Author: Roxy Peck; Chris Olsen; Jay L. Devore
Publisher: Brooks Cole
expand_more
expand_more
format_list_bulleted
Concept explainers
Videos
Textbook Question
Chapter 5.1, Problem 7E
The authors of the paper “Flat-footedness Is Not a Disadvantage for Athletic Performance in Children Aged 11 to 15 Years” (Pediatrics [2009]: e386-e392) studied the relationship between y = Arch height and scores on a number of different motor ability tests for 218 children. They reported the following
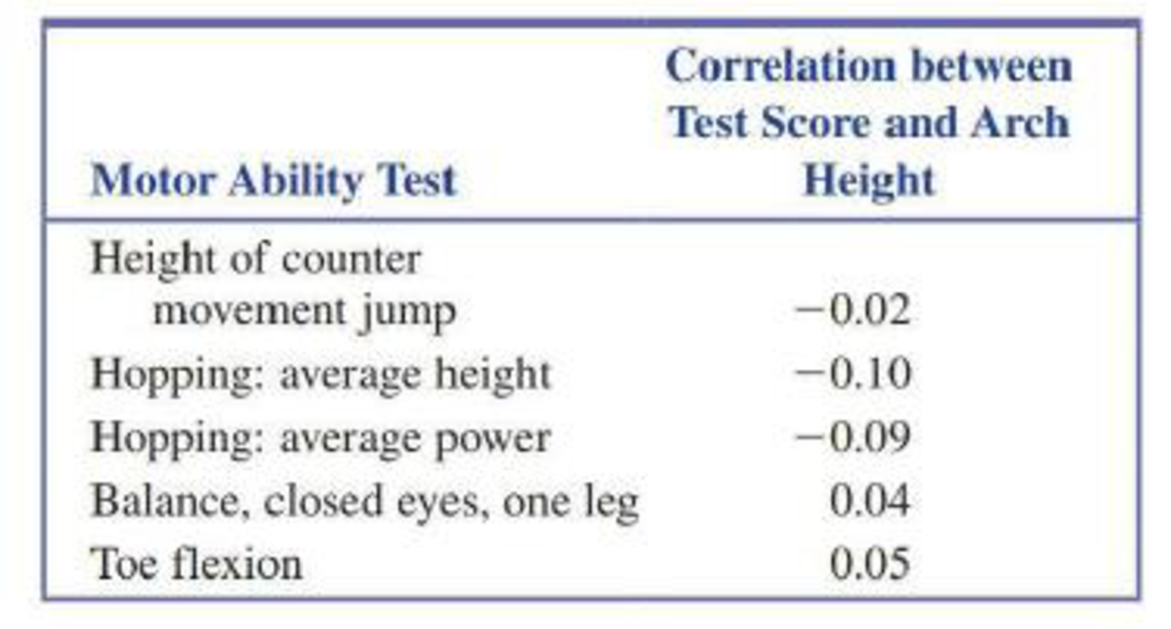
- a. Interpret the value of the
correlation coefficient between average hopping height and arch height. What does the fact that the correlation coefficient is negative say about the relationship? Do higher arch heights tend to be paired with higher or lower average hopping heights? - b. The title of the paper suggests that having a small value for arch height (flat-footedness) is not a disadvantage when it comes to motor skills. Do the given correlation coefficients support this conclusion? Explain.
Expert Solution & Answer

Trending nowThis is a popular solution!

Students have asked these similar questions
Question 2: When John started his first job, his first end-of-year salary was $82,500. In the following years, he received salary raises as shown in the following table.
Fill the Table: Fill the following table showing his end-of-year salary for each year. I have already provided the end-of-year salaries for the first three years. Calculate the end-of-year salaries for the remaining years using Excel. (If you Excel answer for the top 3 cells is not the same as the one in the following table, your formula / approach is incorrect) (2 points)
Geometric Mean of Salary Raises: Calculate the geometric mean of the salary raises using the percentage figures provided in the second column named “% Raise”. (The geometric mean for this calculation should be nearly identical to the arithmetic mean. If your answer deviates significantly from the mean, it's likely incorrect. 2 points)
Hint for the first part of question 2: To assist you with filling out the table in the first part of the question,…
Consider a sample with data values of 27, 25, 20, 15, 30, 34, 28, and 25. Compute the range, interquartile range, variance, and standard deviation (to a maximum of 2 decimals, if decimals are necessary).
Range
Interquartile range
Variance
Standard deviation
Perform a Step by step following tests in Microsoft Excel. Each of the following is 0.5 points, with a total of 6 points. Provide your answers in the following table.
Median
Standard Deviation
Minimum
Maximum
Range
1st Quartile
2nd Quartile
3rd Quartile
Skewness; provide a one sentence explanation of what does the skewness value indicates
Kurtosis; provide a one sentence explanation of what does the kurtosis value indicates
Make a labelled histogram; no point awarded if it is not labelled
Make a labelled boxplot; no point awarded if it is not labelled
Data
27
30
22
25
24
22
20
28
20
26
21
23
24
20
28
30
20
28
29
30
21
26
29
25
26
25
20
30
26
28
25
21
22
27
27
24
26
22
29
28
30
22
22
22
30
21
21
30
26
20
Chapter 5 Solutions
Introduction to Statistics and Data Analysis
Ch. 5.1 - For each of the scatterplots shown, answer the...Ch. 5.1 - For each of the following pairs of variables,...Ch. 5.1 - Is the following statement correct? Explain why or...Ch. 5.1 - Prob. 4ECh. 5.1 - Prob. 5ECh. 5.1 - The accompanying data are x = Cost (cents per...Ch. 5.1 - The authors of the paper Flat-footedness Is Not a...Ch. 5.1 - Prob. 8ECh. 5.1 - Prob. 9ECh. 5.1 - The accompanying data were read from graphs that...
Ch. 5.1 - It may seem odd, but one of the ways biologists...Ch. 5.1 - An auction house released a list of 25 recently...Ch. 5.1 - A sample of automobiles traversing a certain...Ch. 5.2 - Two scatterplots are shown below. Explain why it...Ch. 5.2 - The authors of the paper Statistical Methods for...Ch. 5.2 - Prob. 16ECh. 5.2 - A sample of 548 ethnically diverse students from...Ch. 5.2 - The relationship between hospital patient-to-nurse...Ch. 5.2 - Prob. 19ECh. 5.2 - Prob. 20ECh. 5.2 - Studies have shown that people who suffer sudden...Ch. 5.2 - The data given in the previous exercise on x =...Ch. 5.2 - An article on the cost of housing in Califomia...Ch. 5.2 - The following data on sale price, size, and...Ch. 5.2 - Explain why it can be dangerous to use the...Ch. 5.2 - The sales manager of a large company selected a...Ch. 5.2 - Explain why the slope b of the least-squares line...Ch. 5.2 - Prob. 28ECh. 5.3 - Does it pay to stay in school? The report Trends...Ch. 5.3 - The data in the accompanying table is from the...Ch. 5.3 - Prob. 31ECh. 5.3 - Prob. 32ECh. 5.3 - Some types of algae have the potential to cause...Ch. 5.3 - Prob. 34ECh. 5.3 - Prob. 35ECh. 5.3 - Prob. 36ECh. 5.3 - The article Examined Life: What Stanley H. Kaplan...Ch. 5.3 - Prob. 38ECh. 5.3 - The article California State Parks Closure List...Ch. 5.3 - The article referenced in the previous exercise...Ch. 5.3 - A study was carried out to investigate the...Ch. 5.3 - Both r2 and se are used to assess the fit of a...Ch. 5.3 - Prob. 43ECh. 5.4 - Prob. 44ECh. 5.4 - The paper Aspects of Food Finding by Wintering...Ch. 5.4 - Food intake of grazing animals is limited by the...Ch. 5.4 - Prob. 47ECh. 5.4 - Prob. 48ECh. 5.4 - The paper Population Pressure and Agricultural...Ch. 5.4 - Determining the age of an animal can sometimes be...Ch. 5.5 - The paper How Lead Exposure Relates to Temporal...Ch. 5.5 - The following quote is from the paper Evaluation...Ch. 5 - The accompanying data represent x = Amount of...Ch. 5 - The paper A Cross-National Relationship Between...Ch. 5 - The following data on x = Score on a measure of...Ch. 5 - Prob. 58CRCh. 5 - Prob. 59CRCh. 5 - Prob. 60CRCh. 5 - The paper Effects of Canine Parvovirus (CPV) on...Ch. 5 - The paper Aspects of Food Finding by Wintering...Ch. 5 - Data on salmon availability (x) and the percentage...Ch. 5 - No tortilla chip lover likes soggy chips, so it is...Ch. 5 - The article Reduction is Soluble Protein and...Ch. 5 - An accurate assessment of oxygen consumption...Ch. 5 - Consider the four (x, y) pairs (0, 0), (1, 1), 1,...Ch. 5 - Prob. 1CRECh. 5 - Data from a survey of 1046 adults age 50 and older...Ch. 5 - Prob. 3CRECh. 5 - Prob. 4CRECh. 5 - Prob. 5CRECh. 5 - In August 2009, Harris Interactive released the...Ch. 5 - Prob. 7CRECh. 5 - Prob. 8CRECh. 5 - Prob. 9CRECh. 5 - Prob. 10CRECh. 5 - Prob. 11CRECh. 5 - Prob. 12CRECh. 5 - Prob. 13CRECh. 5 - Cost-to-charge ratios (the percentage of the...Ch. 5 - Prob. 15CRECh. 5 - In the article Reproductive Biology of the Aquatic...Ch. 5 - Prob. 17CRECh. 5 - Prob. 18CRECh. 5 - The paper “Population Pressure and Agricultural...Ch. 5 - Anabolic steroid abuse has been increasing despite...Ch. 5 - Prob. 69ECh. 5 - Prob. 70ECh. 5 - Prob. 71ECh. 5 - Prob. 72ECh. 5 - Suppose the hypothetical data below are from a...Ch. 5 - Prob. 74E
Additional Math Textbook Solutions
Find more solutions based on key concepts
Reading, Writing, and Rounding Whole Numbers Write in words. 357
Mathematics for the Trades: A Guided Approach (11th Edition) (What's New in Trade Math)
1. How is a sample related to a population?
Elementary Statistics: Picturing the World (7th Edition)
Empirical versus Theoretical A Monopoly player claims that the probability of getting a 4 when rolling a six-si...
Introductory Statistics
Let F be a continuous distribution function. If U is uniformly distributed on (0,1), find the distribution func...
A First Course in Probability (10th Edition)
(a) Make a stem-and-leaf plot for these 24 observations on the number of customers who used a down-town CitiBan...
APPLIED STAT.IN BUS.+ECONOMICS
The largest polynomial that divides evenly into a list of polynomials is called the _______.
Elementary & Intermediate Algebra
Knowledge Booster


Learn more about
Need a deep-dive on the concept behind this application? Look no further. Learn more about this topic, statistics and related others by exploring similar questions and additional content below.Similar questions
- Obtain the linear equation for trend for time series with St² = 140, Ey = 16.91 and Σty= 62.02, m n = 7arrow_forwardA quality characteristic of a product is normally distributed with mean μ and standard deviation σ = 1. Speci- fications on the characteristic are 6≤x≤8. A unit that falls within specifications on this quality characteristic results in a profit of Co. However, if x 8, the profit is -C2. Find the value ofμ that maximizes the expected profit.arrow_forwardA) The output voltage of a power supply is normally distributed with mean 5 V and standard deviation 0.02 V. If the lower and upper specifications for voltage are 4.95 V and 5.05 V, respectively, what is the probability that a power supply selected at random conform to the specifications on voltage? B) Continuation of A. Reconsider the power supply manufacturing process in A. Suppose We wanted to improve the process. Can shifting the mean reduce the number of nonconforming units produced? How much would the process variability need to be reduced in order to have all but one out of 1000 units conform to the specifications?arrow_forward
- der to complete the Case X T Civil Service Numerical Test Sec X T Casework Skills Practice Test Maseline Vaseline x + euauthoring.panpowered.com/DeliveryWeb/Civil Service Main/84589a48-6934-4b6e-a6e1-a5d75f559df9?transferToken-News NGSSON The table below shows the best price available for various items from 4 uniform suppliers. The prices do not include VAT (charged at 20%). Item Waterproof boots A1-Uniforms (£)Best Trade (£)Clothing Tech (£)Dress Right (£) 59.99 39.99 59.99 49.99 Trousers 9.89 9.98 9.99 11.99 Shirts 14.99 15.99 16.99 12.99 Hi-Vis vest 4.49 4.50 4.00 4.00 20.00 25.00 19.50 19.99 Hard hats A company needs to buy a set of 12 uniforms which includes 1 of each item. If the special offers are included which supplier is cheapest? OOO A1-Uniforms Best Trade Clothing Tech Q Search + ** 109 8 CO* F10 Home F11 F12 6arrow_forwardto complete the Case × T Civil Service Numerical Test Sec x T Casework Skills Practice Test + Vaseline euauthoring.panpowered.com/DeliveryWeb/Civil Service Main/84589a48-b934-4b6e-a6e1-a5d75f559df9?transferToken=MxNewOS NGFSPSZSMOMzuz The table below shows the best price available for various items from 4 uniform suppliers. The prices do not include VAT (charged at 20%). Item A1-Uniforms (£)Best Trade (£)Clothing Tech (£)Dress Right (£) Waterproof boots 59.99 39.99 59.99 49.99 Trousers 9.89 9.98 9.99 11.99 Shirts 14.99 15.99 16.99 12.99 Hi-Vis vest 4.49 4.50 4.00 4.00 20.00 25.00 19.50 19.99 Hard hats A company needs to buy a set of 12 uniforms which includes 1 of each item. If the special offers are included, which supplier is cheapest? O O O O A1-Uniforms Best Trade Clothing Tech Dress Right Q Search ENG L UK +0 F6 四吧 6 78 ㄓ F10 9% * CO 1 F12 34 Oarrow_forwardCritics review films out of 5 based on three attributes: the story, the special effects and the acting. The ratings of four critics for a film are collected in the table below.CriticSpecialStory rating Effects rating Acting rating Critic 14.44.34.5Critic 24.14.23.9Critic 33.943.4Critic 44.24.14.2Critic 1 also gave the film a rating for the Director's ability. If the average of Critic 1's ratings was 4.3 what rating did they give to the Director's ability?3.94.04.14.24.3arrow_forward
- Two measurements are made of some quantity. For the first measurement, the average is 74.4528, the RMS error is 6.7441, and the uncertainty of the mean is 0.9264. For the second one, the average is 76.8415, the standard deviation is 8.3348, and the uncertainty of the mean is 1.1448. The expected value is exactly 75. 13. Express the first measurement in public notation. 14. Is there a significant difference between the two measurements? 1 15. How does the first measurement compare with the expected value? 16. How does the second measurement compare with the expected value?arrow_forwardA hat contains slips of paper numbered 1 through 6. You draw two slips of paper at random from the hat,without replacing the first slip into the hat.(a) (5 points) Write out the sample space S for this experiment.(b) (5 points) Express the event E : {the sum of the numbers on the slips of paper is 4} as a subset of S.(c) (5 points) Find P(E)(d) (5 points) Let F = {the larger minus the smaller number is 0}. What is P(F )?(e) (5 points) Are E and F disjoint? Why or why not?(f) (5 points) Find P(E ∪ F )arrow_forwardIn addition to the in-school milk supplement program, the nurse would like to increase the use of daily vitamin supplements for the children by visiting homes and educating about the merits of vitamins. She believes that currently, about 50% of families with school-age children give the children a daily megavitamin. She would like to increase this to 70%. She plans a two-group study, where one group serves as a control and the other group receives her visits. How many families should she expect to visit to have 80% power of detecting this difference? Assume that drop-out rate is 5%.arrow_forward
- A recent survey of 400 americans asked whether or not parents do too much for their young adult children. The results of the survey are shown in the data file. a) Construct the frequency and relative frequency distributions. How many respondents felt that parents do too much for their adult children? What proportion of respondents felt that parents do too little for their adult children? b) Construct a pie chart. Summarize the findingsarrow_forwardThe average number of minutes Americans commute to work is 27.7 minutes (Sterling's Best Places, April 13, 2012). The average commute time in minutes for 48 cities are as follows: Click on the datafile logo to reference the data. DATA file Albuquerque 23.3 Jacksonville 26.2 Phoenix 28.3 Atlanta 28.3 Kansas City 23.4 Pittsburgh 25.0 Austin 24.6 Las Vegas 28.4 Portland 26.4 Baltimore 32.1 Little Rock 20.1 Providence 23.6 Boston 31.7 Los Angeles 32.2 Richmond 23.4 Charlotte 25.8 Louisville 21.4 Sacramento 25.8 Chicago 38.1 Memphis 23.8 Salt Lake City 20.2 Cincinnati 24.9 Miami 30.7 San Antonio 26.1 Cleveland 26.8 Milwaukee 24.8 San Diego 24.8 Columbus 23.4 Minneapolis 23.6 San Francisco 32.6 Dallas 28.5 Nashville 25.3 San Jose 28.5 Denver 28.1 New Orleans 31.7 Seattle 27.3 Detroit 29.3 New York 43.8 St. Louis 26.8 El Paso 24.4 Oklahoma City 22.0 Tucson 24.0 Fresno 23.0 Orlando 27.1 Tulsa 20.1 Indianapolis 24.8 Philadelphia 34.2 Washington, D.C. 32.8 a. What is the mean commute time for…arrow_forwardMorningstar tracks the total return for a large number of mutual funds. The following table shows the total return and the number of funds for four categories of mutual funds. Click on the datafile logo to reference the data. DATA file Type of Fund Domestic Equity Number of Funds Total Return (%) 9191 4.65 International Equity 2621 18.15 Hybrid 1419 2900 11.36 6.75 Specialty Stock a. Using the number of funds as weights, compute the weighted average total return for these mutual funds. (to 2 decimals) % b. Is there any difficulty associated with using the "number of funds" as the weights in computing the weighted average total return in part (a)? Discuss. What else might be used for weights? The input in the box below will not be graded, but may be reviewed and considered by your instructor. c. Suppose you invested $10,000 in this group of mutual funds and diversified the investment by placing $2000 in Domestic Equity funds, $4000 in International Equity funds, $3000 in Specialty Stock…arrow_forward
arrow_back_ios
SEE MORE QUESTIONS
arrow_forward_ios
Recommended textbooks for you
 Big Ideas Math A Bridge To Success Algebra 1: Stu...AlgebraISBN:9781680331141Author:HOUGHTON MIFFLIN HARCOURTPublisher:Houghton Mifflin Harcourt
 Glencoe Algebra 1, Student Edition, 9780079039897...AlgebraISBN:9780079039897Author:CarterPublisher:McGraw Hill
Big Ideas Math A Bridge To Success Algebra 1: Stu...
Algebra
ISBN:9781680331141
Author:HOUGHTON MIFFLIN HARCOURT
Publisher:Houghton Mifflin Harcourt
Glencoe Algebra 1, Student Edition, 9780079039897...
Algebra
ISBN:9780079039897
Author:Carter
Publisher:McGraw Hill
Correlation Vs Regression: Difference Between them with definition & Comparison Chart; Author: Key Differences;https://www.youtube.com/watch?v=Ou2QGSJVd0U;License: Standard YouTube License, CC-BY
Correlation and Regression: Concepts with Illustrative examples; Author: LEARN & APPLY : Lean and Six Sigma;https://www.youtube.com/watch?v=xTpHD5WLuoA;License: Standard YouTube License, CC-BY