
Concept explainers
Videos
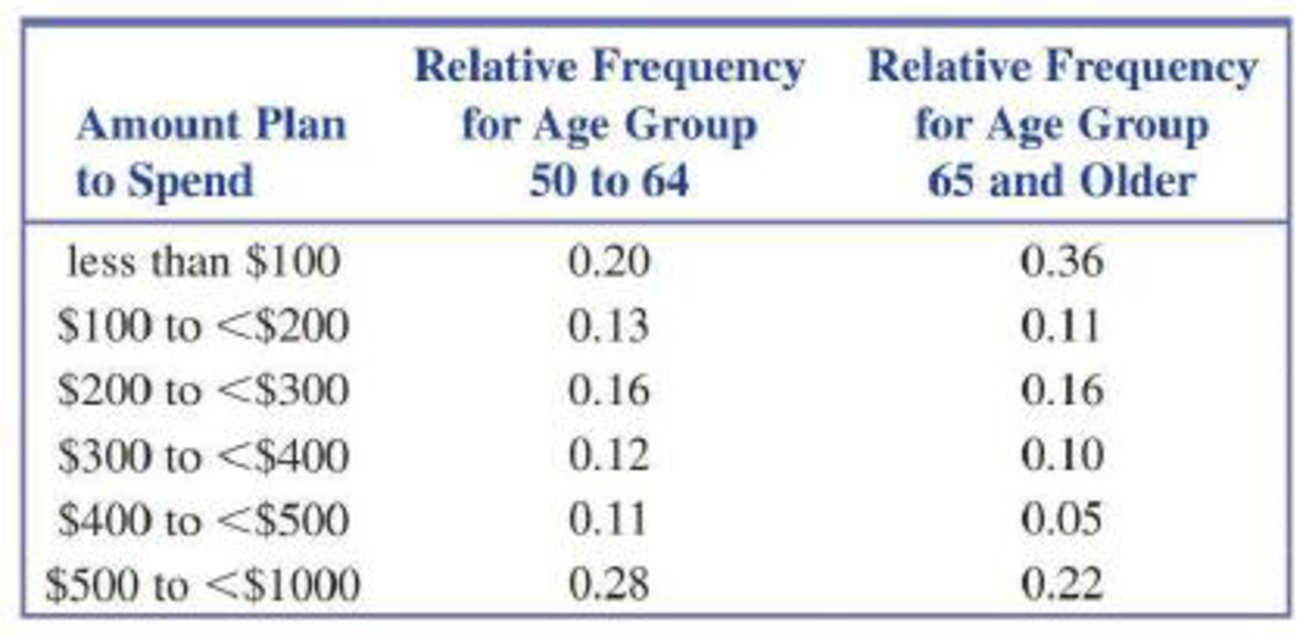
Data from a survey of 1046 adults age 50 and older were summarized in the AARP Bulletin (November 2009). The following table gives relative frequency distributions of the responses to the question, “How much do you plan to spend for holiday gifts this year?” for respondents age 50 to 64 and for respondents age 65 and older.
Construct a histogram for each of the two age groups and comment on the differences between the two age groups. (Notice that the interval widths in the relative frequency distribution are not the same, so you shouldn’t use relative frequency on the y-axis for your histograms.)

Trending nowThis is a popular solution!

Chapter 5 Solutions
Introduction to Statistics and Data Analysis
Additional Math Textbook Solutions
Introductory Statistics (10th Edition)
EBK STATISTICAL TECHNIQUES IN BUSINESS
Fundamentals of Statistics (5th Edition)
Business Statistics: A First Course (8th Edition)
PRACTICE OF STATISTICS F/AP EXAM


 Glencoe Algebra 1, Student Edition, 9780079039897...AlgebraISBN:9780079039897Author:CarterPublisher:McGraw Hill
 Big Ideas Math A Bridge To Success Algebra 1: Stu...AlgebraISBN:9781680331141Author:HOUGHTON MIFFLIN HARCOURTPublisher:Houghton Mifflin Harcourt
 Holt Mcdougal Larson Pre-algebra: Student Edition...AlgebraISBN:9780547587776Author:HOLT MCDOUGALPublisher:HOLT MCDOUGAL