
Introduction to Statistics and Data Analysis
5th Edition
ISBN: 9781305115347
Author: Roxy Peck; Chris Olsen; Jay L. Devore
Publisher: Brooks Cole
expand_more
expand_more
format_list_bulleted
Videos
Textbook Question
Chapter 5, Problem 65CR
The article “Reduction is Soluble Protein and Chlorophyll Contents in a Few Plants as Indicators of Automobile Exhaust Pollution” (International Journal of Environmental Studies [1983]: 239–244) reported the following data on x = Distance from a highway (in meters) and y = Lead content of soil at that distance (in parts per million):
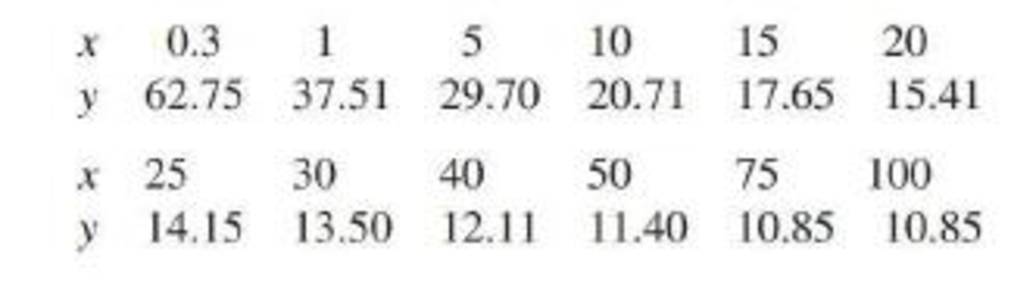
- a. Use a statistical computer package to construct
scatterplots of y versus x, y versus log(x), log(y) versus log(x), and - b. Which transformation considered in Part (a) does the best job of producing an approximately linear relationship? Use the selected transformation to predict lead content when distance is 25 m.
Expert Solution & Answer
Want to see the full answer?
Check out a sample textbook solution
Students have asked these similar questions
A paper gives data on x = change in Body Mass Index (BMI, in kilograms/meter?) and y = change in a measure of depression for patients suffering from depression who participated in a pulmonary rehabilitation program. The table below contains a subset of the data given in the paper and are
approximate values read from a scatterplot in the paper.
BMI Change (kg/m²)
0.5
-0.5
0.1
0.7 0.8
1
1.5
1.2 1
0.4
0.4
Depression Score Change
-1
4
4
5
8
13
14
17
18
12
14
The accompanying computer output is from Minitab.
Fitted Line Plot
Depression score change = 6.512 + 5.472 BMI change
5.26270
20-
R-Sq
R-Sq (adj) 19.88%
27.16%
15-
10-
5-
0-
-0.5
0.0
0.5
1.0
1.5
BMI change
R-są
5.26270
27.16%
Coefficients
Term
Coef
SE Coef
T-Value
P-Value
VIF
6.512
5.472
Constant
2.26
2.88
0.0164
BMI change
2.83
1.93
0.0823
1.00
Regression Equation
Depression score change = 6.512 + 5.472 BMI change
(a) What percentage of observed variation in depression score change can be explained by the simple linear regression…
A paper gives data on x = change in Body Mass Index (BMI, in kilograms/meter2) and y = change in a measure of depression for patients suffering from depression who participated in a pulmonary rehabilitation program. The table below contains a subset of the data
given in the paper and are approximate values read from a scatterplot in the paper.
BMI Change (kg/m²)
0.5 -0.5 0
0.1 0.7 0.8
1
1.5
1.2
1
0.4 0.4
Depression Score Change -1
9
4
4
5
8
13
14 17 18
12
14
The accompanying computer output is from Minitab.
Fitted Line Plot
Depression score change = 6.512 + 5.472 BMI change
20
S
5.26270
R-Sq
27.16%
R-Sq (adj) 19.88%
15-
:
10-
-0.5 0.0
1.5
Ⓡ
S
5.26270
Coefficients
Term
Coef
VIF
SE Coef
2.26
T-Value
2.88
P-Value
0.0164
Constant
6.512
BMI change
5.472
2.83
1.93
0.0823 1.00
Regression Equation
Depression score change = 6.512 + 5.472 BMI change
(a) What percentage of observed variation in depression score change can be explained by the simple linear regression model? (Round your answer to…
A paper gives data on x = change in Body Mass Index (BMI, in kilograms/meter) and y = change in a measure of depression for patients suffering from depression who participated in a pulmonary rehabilitation program. The table below
contains a subset of the data given in the paper and are approximate values read from a scatterplot in the paper.
BMI Change (kg/m²)
-0.5
0.7
0.5
0.1
0.8
1
1.5
1.2
1
0.4
0.4
Depression Score Change
-1
4
4
8
13
14
16
18
12
14
The accompanying computer output is from Minitab.
Fitted Line Plot
Depression score change = 6.598 + 5.327 BMI change
20-
5.10254
R-Sq
R-Sq (adj) 20.06%
27.32%
15-
10-
5-
0-
-0.5
0.0
0.5
1.0
1.5
BMI change
R-sq
5.10254
27.32%
Coefficients
Term
Coef
SE Coef
T-Value
P-Value
VIF
Constant
6.598
2.19
3.01
0.0132
BMI change
5.327
2.75
1.94
0.0812
1.00
Regression Equation
Depression score change = 6.598 + 5.327 BMI change
(a) What percentage of observed variation in depression score change can be explained by the simple linear regression model?…
Chapter 5 Solutions
Introduction to Statistics and Data Analysis
Ch. 5.1 - For each of the scatterplots shown, answer the...Ch. 5.1 - For each of the following pairs of variables,...Ch. 5.1 - Is the following statement correct? Explain why or...Ch. 5.1 - Prob. 4ECh. 5.1 - Prob. 5ECh. 5.1 - The accompanying data are x = Cost (cents per...Ch. 5.1 - The authors of the paper Flat-footedness Is Not a...Ch. 5.1 - Prob. 8ECh. 5.1 - Prob. 9ECh. 5.1 - The accompanying data were read from graphs that...
Ch. 5.1 - It may seem odd, but one of the ways biologists...Ch. 5.1 - An auction house released a list of 25 recently...Ch. 5.1 - A sample of automobiles traversing a certain...Ch. 5.2 - Two scatterplots are shown below. Explain why it...Ch. 5.2 - The authors of the paper Statistical Methods for...Ch. 5.2 - Prob. 16ECh. 5.2 - A sample of 548 ethnically diverse students from...Ch. 5.2 - The relationship between hospital patient-to-nurse...Ch. 5.2 - Prob. 19ECh. 5.2 - Prob. 20ECh. 5.2 - Studies have shown that people who suffer sudden...Ch. 5.2 - The data given in the previous exercise on x =...Ch. 5.2 - An article on the cost of housing in Califomia...Ch. 5.2 - The following data on sale price, size, and...Ch. 5.2 - Explain why it can be dangerous to use the...Ch. 5.2 - The sales manager of a large company selected a...Ch. 5.2 - Explain why the slope b of the least-squares line...Ch. 5.2 - Prob. 28ECh. 5.3 - Does it pay to stay in school? The report Trends...Ch. 5.3 - The data in the accompanying table is from the...Ch. 5.3 - Prob. 31ECh. 5.3 - Prob. 32ECh. 5.3 - Some types of algae have the potential to cause...Ch. 5.3 - Prob. 34ECh. 5.3 - Prob. 35ECh. 5.3 - Prob. 36ECh. 5.3 - The article Examined Life: What Stanley H. Kaplan...Ch. 5.3 - Prob. 38ECh. 5.3 - The article California State Parks Closure List...Ch. 5.3 - The article referenced in the previous exercise...Ch. 5.3 - A study was carried out to investigate the...Ch. 5.3 - Both r2 and se are used to assess the fit of a...Ch. 5.3 - Prob. 43ECh. 5.4 - Prob. 44ECh. 5.4 - The paper Aspects of Food Finding by Wintering...Ch. 5.4 - Food intake of grazing animals is limited by the...Ch. 5.4 - Prob. 47ECh. 5.4 - Prob. 48ECh. 5.4 - The paper Population Pressure and Agricultural...Ch. 5.4 - Determining the age of an animal can sometimes be...Ch. 5.5 - The paper How Lead Exposure Relates to Temporal...Ch. 5.5 - The following quote is from the paper Evaluation...Ch. 5 - The accompanying data represent x = Amount of...Ch. 5 - The paper A Cross-National Relationship Between...Ch. 5 - The following data on x = Score on a measure of...Ch. 5 - Prob. 58CRCh. 5 - Prob. 59CRCh. 5 - Prob. 60CRCh. 5 - The paper Effects of Canine Parvovirus (CPV) on...Ch. 5 - The paper Aspects of Food Finding by Wintering...Ch. 5 - Data on salmon availability (x) and the percentage...Ch. 5 - No tortilla chip lover likes soggy chips, so it is...Ch. 5 - The article Reduction is Soluble Protein and...Ch. 5 - An accurate assessment of oxygen consumption...Ch. 5 - Consider the four (x, y) pairs (0, 0), (1, 1), 1,...Ch. 5 - Prob. 1CRECh. 5 - Data from a survey of 1046 adults age 50 and older...Ch. 5 - Prob. 3CRECh. 5 - Prob. 4CRECh. 5 - Prob. 5CRECh. 5 - In August 2009, Harris Interactive released the...Ch. 5 - Prob. 7CRECh. 5 - Prob. 8CRECh. 5 - Prob. 9CRECh. 5 - Prob. 10CRECh. 5 - Prob. 11CRECh. 5 - Prob. 12CRECh. 5 - Prob. 13CRECh. 5 - Cost-to-charge ratios (the percentage of the...Ch. 5 - Prob. 15CRECh. 5 - In the article Reproductive Biology of the Aquatic...Ch. 5 - Prob. 17CRECh. 5 - Prob. 18CRECh. 5 - The paper “Population Pressure and Agricultural...Ch. 5 - Anabolic steroid abuse has been increasing despite...Ch. 5 - Prob. 69ECh. 5 - Prob. 70ECh. 5 - Prob. 71ECh. 5 - Prob. 72ECh. 5 - Suppose the hypothetical data below are from a...Ch. 5 - Prob. 74E
Additional Math Textbook Solutions
Find more solutions based on key concepts
2.18 Graph the relative frequency histogram for the 500 measurements summarized in the accompanying relative fr...
Statistics for Business and Economics (13th Edition)
Develop a spreadsheet for computing the demand for any values of the input variables in the linear demand and n...
Business Analytics
A Pew Research Center survey found a noticeable rise in smartphone ownership and internet usage in emerging and...
Business Statistics: A First Course (8th Edition)
AVX Home Entertainment, Inc., recently began a “no-hassles” return policy. A sample of 500 customers who recent...
EBK STATISTICAL TECHNIQUES IN BUSINESS
(a) Make a stem-and-leaf plot for these 24 observations on the number of customers who used a down-town CitiBan...
Applied Statistics in Business and Economics
In Hamilton County, Ohio, the mean number of days needed to sell a house is 86 days (Cincinnati Multiple Listin...
STATISTICS F/BUSINESS+ECONOMICS-TEXT
Knowledge Booster


Learn more about
Need a deep-dive on the concept behind this application? Look no further. Learn more about this topic, statistics and related others by exploring similar questions and additional content below.Similar questions
- Find the equation of the regression line for the following data set. x 1 2 3 y 0 3 4arrow_forwardTurbid water is muddy or cloudy water. Sunlight is necessary for most life forms; thus turbid water is considered a threat to wetland ecosystems. Passive filtration systems are commonly used to reduce turbidity in wetlands. Suspended solids are measured in mg/l. Is there a relation between input and output turbidity for a passive filtration system and, if so, is it statistically significant? At a wetlands environment in Illinois, the inlet and outlet turbidity of a passive filtration system have been measured. A random sample of measurements are shown below. (Reference: EPA Wetland Case Studies.) Reading Inlet (mg/l) Outlet (mg/l) 3 4 5 6 7 8 9 10 11 12 31.6 86.9 87.0 12.0 45.4 43.3 32.3 77.7 71.7 85.9 64.9 80.1 3.3 14.2 16.8 5.7 4.6 6.2 3.4 7.7 8.0 7.4 8.7 14.3 Use a 1% level of significance to test the claim that there is a monotone relationship (either way) between the ranks of the inlet readings and outlet readings. (a) Rank-order the inlet readings using 1 as the largest data…arrow_forwardTurbid water is muddy or cloudy water. Sunlight is necessary for most life forms; thus turbid water is considered a threat to wetland ecosystems. Passive filtration systems are commonly used to reduce turbidity in wetlands. Suspended solids are measured in mg/l. Is there a relation between input and output turbidity for a passive filtration system and, if so, is it statistically significant? At a wetlands environment in Illinois, the inlet and outlet turbidity of a passive filtration system have been measured. A random sample of measurements are shown below. (Reference: EPA Wetland Case Studies.) Reading 1 2 3 4 5 6 7 8 9 10 11 12 Inlet (mg/l) 59.1 25.7 70.5 71.0 37.6 43.5 13.1 24.2 16.7 49.1 67.6 31.7 Outlet (mg/l) 18.2 14.3 15.3 17.5 13.1 8.0 4.1 4.4 4.3 5.8 16.3 7.1 Use a 1% level of significance to test the claim that there is a monotone relationship (either way) between the ranks of the inlet readings and outlet readings. (a) Rank-order the inlet readings using 1 as…arrow_forward
- Turbid water is muddy or cloudy water. Sunlight is necessary for most life forms; thus turbid water is considered a threat to wetland ecosystems. Passive filtration systems are commonly used to reduce turbidity in wetlands. Suspended solids are measured in mg/l. Is there a relation between input and output turbidity for a passive filtration system and, if so, is it statistically significant? At a wetlands environment in Illinois, the inlet and outlet turbidity of a passive filtration system have been measured. A random sample of measurements are shown below. (Reference: EPA Wetland Case Studies.) Reading 1 2 3 4 5 6 7 8 9 10 11 12 Inlet (mg/l) 62.1 13.8 63.5 30.6 91.1 11.5 67.2 75.6 79.3 29.5 72.9 21.3 Outlet (mg/l) 11.3 2.7 7.5 12.3 12.9 3.8 13.3 13.2 15.1 6.0 7.0 4.7 Use a 1% level of significance to test the claim that there is a monotone relationship (either way) between the ranks of the inlet readings and outlet readings. (a) Rank-order the inlet readings using 1 as…arrow_forwardTurbid water is muddy or cloudy water. Sunlight is necessary for most life forms; thus turbid water is considered a threat to wetland ecosystems. Passive filtration systems are commonly used to reduce turbidity in wetlands. Suspended solids are measured in mg/l. Is there a relation between input and output turbidity for a passive filtration system and, if so, is it statistically significant? At a wetlands environment in Illinois, the inlet and outlet turbidity of a passive filtration system have been measured. A random sample of measurements are shown below. (Reference: EPA Wetland Case Studies.) Use a 1% level of significance to test the claim that there is a monotone relationship (either way) between the ranks of the inlet readings and outlet readings. (a) Rank-order the inlet readings using 1 as the largest data value. Also rank-order the outlet readings using 1 as the largest data value. Then construct a table of ranks to be used for a Spearman rank correlation test. (c) Compute…arrow_forwardPlants emit gases that trigger the ripening of fruit, attract pollinators, and cue other physiological responses. A study examined factors that affect the emission of volatile compounds by a type of potato plant. The volatile compounds analyzed were hydrocarbons used by other plants and animals. Following are data on plant weight (x), in grams, and quantity of volatile compounds emitted (y), in hundreds of nanograms, for 11 potato plants. Use this information to complete parts (a) through (d). 58 85 57 65 52 67 62 80 76 52 68 y 8.5 22 10 22.5 12.5 11.5 7 13 16.5 , 21.5 11 (Exv - (Ex)(E»)/n) Ex - (Ex)*/ 2 a. Compute SST, SSR, and SSE, using the formulas SST= - ΣΥ- Σν)' /n. ssR = and SSE = SST – SSR. %3D SST = (Type an integer or decimal rounded to two decimal places as needed.) SSR = (Type an integer or decimal rounded to two decimal places as needed.) SSE = (Type an integer or decimal rounded to two decimal places as needed.) b. Compute the coefficient of determination, 2 %3D (Type an…arrow_forward
- Number 2 pls.arrow_forwardOcean currents are important in studies of climate change, as well as ecology studies of dispersal of plankton. Drift bottles are used to study ocean currents in the Pacific near Hawaii, the Solomon Islands, New Guinea, and other islands. Let x represent the number of days to recovery of a drift bottle after release and y represent the distance from point of release to point of recovery in km/100. The following data are representative of one study using drift bottles to study ocean currents. 203 x days y km/100 72 76 32 14.7 94 11.7 19.5 5.3 35.6 (a) Verify that Ex = 477, Ey = 86.8, Ex? = 62,029, Ey2 = 2028.68, Exy = 11036.6, and r= 0.93853. Ex Ey Ex? Ey2| Exy (b) Use a 1% level of significance to test the claim p> 0. (Use 2 decimal places.) critical t Conclusion Reject the null hypothesis, there is sufficient evidence that p > 0. Reject the null hypothesis, there is insufficient evidence that p > 0. O Fail to reject the null hypothesis, there is insufficient evidence that p > 0. O…arrow_forwardThe following equations were estimated using the data in BWGHT: log(bwght) = 4.66 - 0044 cigs + .0093 log(faminc) + .016 parity (.0059) (.22) (.0009) (.006) + .027 male + .055 white (.010) (.013) 1,388, R = .0472 and log(bwght) 4.65 – .0052 cigs + .0110 log(faminc) + .017 parity (.006) (.38) (.0010) (.0085) + .034 male + .045 white – .0030 motheduc + .0032 fatheduc (.011) (.015) (.0030) (.0026) n = 1,191, R2 = .0493. %3Darrow_forward
- A marketing manager conducted a study to determine the relationship between money spent on advertising (X) and company sales (Y). The study consisted of 8 companies and the data is given below and is in units of $1000s (ie. 2.4 = $2400.00) d. What is the resulting residual value when advertising expenditure is $2200.00 (X = 2.2), that is the difference between the actual observed value of y and the predicted value of y when using the fitted regression equation? e. What percentage of the variation in company sales is explained by the regression equation? In other words, what is the variability in Y that is due to advertising? Does a…arrow_forwardFifty male subjects drank a measured amount x (in ounces) of a medication and the concentration y (in percent) in their blood of the active ingredient was measured 30 minutes later. The sample data are summarized by the following information: n = 50 Ex = 112.5 Ex? = 356.25 %3D Ey = 4.83 Ey = 0.667 Exy = 15.255 0 < x < 4.5 Or= 0.875 Or= 0.709 Or= -0.846 Or=0.460 Or= 0.965arrow_forwardIdentify the description(s) that adhere to the requirements for testing a population correlation between variables X and Y. The log-transformed version of Y and X have a linear relationship. The shape of the scatter plot for the data collected for the X and Y variables is shaped like a funnel. The scatter plot for the data collected for the X and Y variables do not show any outliers. The frequency histograms for X and Y separately are each normally distributed.arrow_forward
arrow_back_ios
SEE MORE QUESTIONS
arrow_forward_ios
Recommended textbooks for you
 Glencoe Algebra 1, Student Edition, 9780079039897...AlgebraISBN:9780079039897Author:CarterPublisher:McGraw Hill
 Functions and Change: A Modeling Approach to Coll...AlgebraISBN:9781337111348Author:Bruce Crauder, Benny Evans, Alan NoellPublisher:Cengage Learning
Glencoe Algebra 1, Student Edition, 9780079039897...
Algebra
ISBN:9780079039897
Author:Carter
Publisher:McGraw Hill
Functions and Change: A Modeling Approach to Coll...
Algebra
ISBN:9781337111348
Author:Bruce Crauder, Benny Evans, Alan Noell
Publisher:Cengage Learning
Hypothesis Testing using Confidence Interval Approach; Author: BUM2413 Applied Statistics UMP;https://www.youtube.com/watch?v=Hq1l3e9pLyY;License: Standard YouTube License, CC-BY
Hypothesis Testing - Difference of Two Means - Student's -Distribution & Normal Distribution; Author: The Organic Chemistry Tutor;https://www.youtube.com/watch?v=UcZwyzwWU7o;License: Standard Youtube License