Videos
a.
If the graph shows a positive, negative or no
a.
Explanation of Solution
Given information:
The table shows the median age of females when they were first married.
| Year | Age |
| 2001 | 25.1 |
| 2002 | 25.3 |
| 2003 | 25.3 |
| 2004 | 25.3 |
| 2005 | 25.5 |
| 2006 | 25.9 |
| 2007 | 26 |
| 2008 | 26.2 |
| 2009 | 26.5 |
| 2010 | 26.7 |
| 2011 | 26.9 |
Calculations:
Here the graph of year versus age is drawn.
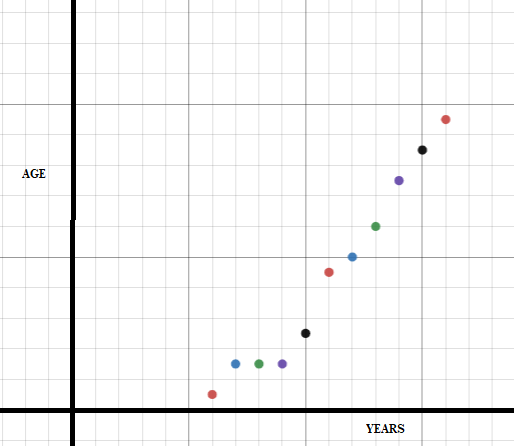
Here the graph shows a
b.
A line of fit for the scatter plot.
b.
Explanation of Solution
Given information:
The table shows the median age of females when they were first married.
| Year | Age |
| 2001 | 25.1 |
| 2002 | 25.3 |
| 2003 | 25.3 |
| 2004 | 25.3 |
| 2005 | 25.5 |
| 2006 | 25.9 |
| 2007 | 26 |
| 2008 | 26.2 |
| 2009 | 26.5 |
| 2010 | 26.7 |
| 2011 | 26.9 |
Calculations:
Here the graph of year versus age is drawn.
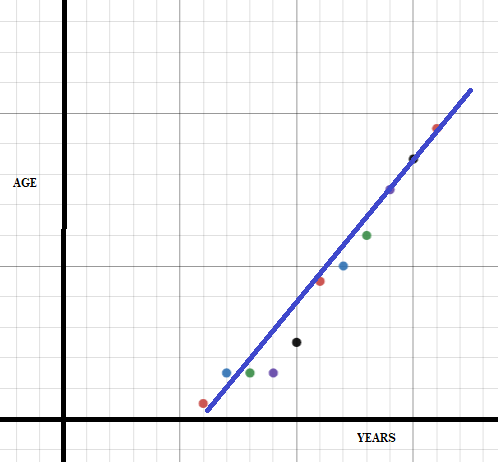
Here the graph shows a positive correlation. In the graph of positive correlation, as the X-parameter increases, the Y-parameter also increases. Here in this graph the age is shown in X-axis and year is shown in Y-axis. So as the year increases the age also increases. So the graph shows a positive correlation. Here line of fit for the scatter plot is drawn.
c.
An equation in slope intercept form for the line in fit.
c.
Explanation of Solution
Given information:
The table shows the median age of females when they were first married.
| Year | Age |
| 2001 | 25.1 |
| 2002 | 25.3 |
| 2003 | 25.3 |
| 2004 | 25.3 |
| 2005 | 25.5 |
| 2006 | 25.9 |
| 2007 | 26 |
| 2008 | 26.2 |
| 2009 | 26.5 |
| 2010 | 26.7 |
| 2011 | 26.9 |
Calculations:
Here the graph of year versus age is drawn.

Here the graph shows a positive correlation. In the graph of positive correlation, as the X-parameter increases, the Y-parameter also increases. Here in this graph the age is shown in X-axis and year is shown in Y-axis. So as the year increases the age also increases. So the graph shows a positive correlation. Here line of fit for the scatter plot is drawn.
Equation of the line of line in fit is,
So the equation is
d.
The median age of females when they are first married in the year
d.
Explanation of Solution
Given information:
The table shows the median age of females when they were first married.
| Year | Age |
| 2001 | 25.1 |
| 2002 | 25.3 |
| 2003 | 25.3 |
| 2004 | 25.3 |
| 2005 | 25.5 |
| 2006 | 25.9 |
| 2007 | 26 |
| 2008 | 26.2 |
| 2009 | 26.5 |
| 2010 | 26.7 |
| 2011 | 26.9 |
Calculations:
Here the graph of year versus age is drawn.

Here the graph shows a positive correlation. Here line of fit for the scatter plot is drawn.
Equation of the line of line in fit is,
So the equation is
Now to get the age of females in year
Thus,
Thus the median age of females when they are first married in the year
Chapter 4 Solutions
Algebra 1, Homework Practice Workbook (MERRILL ALGEBRA 1)
Additional Math Textbook Solutions
Introductory Statistics
Basic Business Statistics, Student Value Edition
Elementary Statistics: Picturing the World (7th Edition)
Algebra and Trigonometry (6th Edition)
Pre-Algebra Student Edition
Intro Stats, Books a la Carte Edition (5th Edition)


- Find a polynomial with integer coefficients that satisfies the given conditions. T(x) has degree 4, zeros i and 1 + i, and constant term 12.arrow_forwardHow to solve 2542000/64132 without a calculator?arrow_forwardHow much is the circumference of a circle whose diameter is 7 feet?C =π darrow_forward
- How to solve 2542/64.132arrow_forwardAssume that you fancy polynomial splines, while you actually need ƒ(t) = e²/3 – 1 for t€ [−1, 1]. See the figure for a plot of f(t). Your goal is to approximate f(t) with an inter- polating polynomial spline of degree d that is given as sa(t) = • Σk=0 Pd,k bd,k(t) so that sd(tk) = = Pd,k for tk = −1 + 2 (given d > 0) with basis functions bd,k(t) = Σi±0 Cd,k,i = • The special case of d 0 is trivial: the only basis function b0,0 (t) is constant 1 and so(t) is thus constant po,0 for all t = [−1, 1]. ...9 The d+1 basis functions bd,k (t) form a ba- sis Bd {ba,o(t), ba,1(t), bd,d(t)} of the function space of all possible sα (t) functions. Clearly, you wish to find out, which of them given a particular maximal degree d is the best-possible approximation of f(t) in the least- squares sense. _ 1 0.9 0.8 0.7 0.6 0.5 0.4 0.3 0.2 0.1 0 -0.1 -0.2 -0.3 -0.4 -0.5 -0.6 -0.7 -0.8 -0.9 -1 function f(t) = exp((2t)/3) - 1 to project -1 -0.9 -0.8 -0.7 -0.6 -0.5 -0.4 -0.3 -0.2 -0.1 0 0.1 0.2 0.3 0.4 0.5…arrow_forwardAn image processor considered a 750×750 pixels large subset of an image and converted it into gray-scale, resulting in matrix gIn - a false-color visualization of gIn is shown in the top-left below. He prepared a two-dim. box filter f1 as a 25×25 matrix with only the 5×5 values in the middle being non-zero – this filter is shown in the top-middle position below. He then convolved £1 with itself to get £2, before convolving £2 with itself to get f3. In both of the steps, he maintained the 25×25 size. Next, he convolved gIn with £3 to get gl. Which of the six panels below shows g1? Argue by explaining all the steps, so far: What did the image processor do when preparing ₤3? What image processing operation (from gin to g1) did he prepare and what's the effect that can be seen? Next, he convolved the rows of f3 with filter 1/2 (-1, 8, 0, -8, 1) to get f4 - you find a visualization of filter f 4 below. He then convolved gIn with f4 to get g2 and you can find the result shown below. What…arrow_forward
- 3ur Colors are enchanting and elusive. A multitude of color systems has been proposed over a three-digits number of years - maybe more than the number of purposes that they serve... - Everyone knows the additive RGB color system – we usually serve light-emitting IT components like monitors with colors in that system. Here, we use c = (r, g, b) RGB with r, g, bЄ [0,1] to describe a color c. = T For printing, however, we usually use the subtractive CMY color system. The same color c becomes c = (c, m, y) CMY (1-c, 1-m, 1-y) RGB Note how we use subscripts to indicate with coordinate system the coordinates correspond to. Explain, why it is not possible to find a linear transformation between RGB and CMY coordinates. Farbenlehr c von Goethe Erster Band. Roſt einen Defte mit fergen up Tübingen, is et 3. Cotta'fden Babarblung. ISIO Homogeneous coordinates give us a work-around: If we specify colors in 4D, instead, with the 4th coordinate being the homogeneous coordinate h so that every actual…arrow_forwardCan someone provide an answer & detailed explanation please? Thank you kindly!arrow_forwardGiven the cubic function f(x) = x^3-6x^2 + 11x- 6, do the following: Plot the graph of the function. Find the critical points and determine whether each is a local minimum, local maximum, or a saddle point. Find the inflection point(s) (if any).Identify the intervals where the function is increasing and decreasing. Determine the end behavior of the graph.arrow_forward
- Given the quadratic function f(x) = x^2-4x+3, plot the graph of the function and find the following: The vertex of the parabola .The x-intercepts (if any). The y-intercept. Create graph also before solve.arrow_forwardwhat model best fits this dataarrow_forwardRound as specified A) 257 down to the nearest 10’s place B) 650 to the nearest even hundreds, place C) 593 to the nearest 10’s place D) 4157 to the nearest hundreds, place E) 7126 to the nearest thousand place arrow_forward
 Algebra and Trigonometry (6th Edition)AlgebraISBN:9780134463216Author:Robert F. BlitzerPublisher:PEARSON
 Contemporary Abstract AlgebraAlgebraISBN:9781305657960Author:Joseph GallianPublisher:Cengage Learning
 Linear Algebra: A Modern IntroductionAlgebraISBN:9781285463247Author:David PoolePublisher:Cengage Learning
 Algebra And Trigonometry (11th Edition)AlgebraISBN:9780135163078Author:Michael SullivanPublisher:PEARSON
 Introduction to Linear Algebra, Fifth EditionAlgebraISBN:9780980232776Author:Gilbert StrangPublisher:Wellesley-Cambridge Press
 College Algebra (Collegiate Math)AlgebraISBN:9780077836344Author:Julie Miller, Donna GerkenPublisher:McGraw-Hill Education